- Who We Serve
- What We Do
- About Us
- Insights & Research
- Who We Serve
- What We Do
- About Us
- Insights & Research
A Risk-Control, Risk-Asset Framework for Asset Allocation
Constructing portfolios from risk-control, risk-asset building blocks can lead to enhanced risk management.
By Peter Mladina, Executive Director of Portfolio Research, Wealth Management
Charles Grant, CFA, Director of Asset Allocation, Wealth Management
We demonstrated in Compensated Portfolio Risk that term and market risk factors are the systematic risks that almost entirely explain the compensated return and risk of multi-asset class portfolios. Conventional asset classes have overlapping exposures to these two primary risk factors. For portfolio construction and risk management purposes, we categorize conventional asset classes into “risk-control” or “risk-asset” subportfolios based on their sensitivities to term and market risk factors. The term factor represents maturity-related interest rate risk, and it is commonly defined as the return of Treasury bonds minus the return of Treasury bills. The market factor represents equity and equity-like default risks, and it is commonly defined as the return of stocks minus the return of Treasury bills.
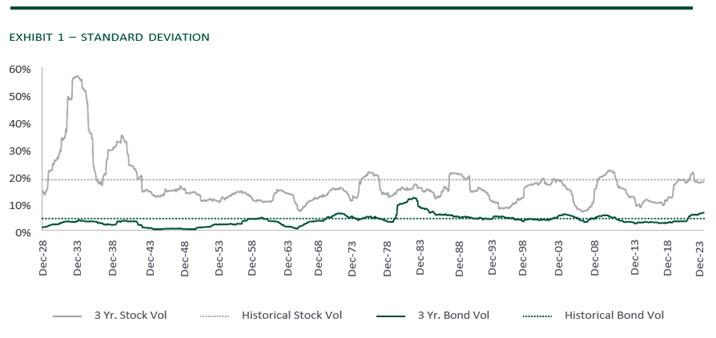
Standard deviations (return volatility) and correlations are the risk characteristics that matter for asset allocation. As independent risk premiums, term and market factors have different volatilities and they are largely uncorrelated with each other. Exhibits 1 and 2 show historical risk characteristics for Treasury bonds and stocks.1 Exhibit 1 shows that over the full history Treasury bonds have had a standard deviation of just 4%, which compares to 19% for stocks. When viewing short time periods (rolling 3-year windows), the standard deviation of Treasury bonds is always materially lower than the standard deviation of stocks. The standard deviation of Treasury bonds peaked at 12% in a 3-year period that occurred during the interest rate spike of the early 1980s. In contrast, the standard deviation of stocks peaked at 57% during a 3-year period that occurred during the Great Depression.
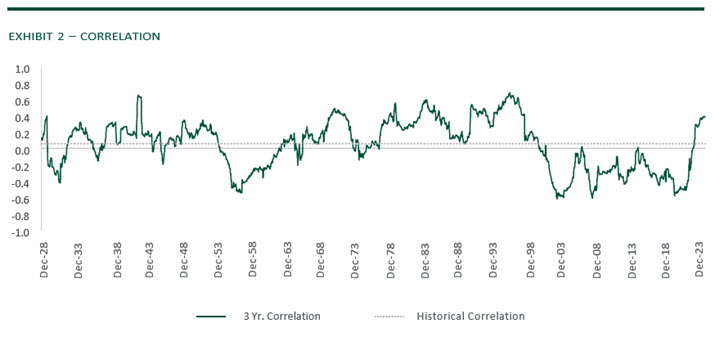
Correlations measure the degree to which assets comove from their respected average returns, capturing the diversification benefit. True risk factors should be lowly correlated. Exhibit 2 shows that over the full history the correlation between Treasury bonds and stocks is close to zero (0.06), confirming that they are different sources of risk (and return). The correlation between Treasury bonds and stocks varies over the short run (rolling 3-year windows), from 0.68 to -0.62 in Exhibit 2. But it is never highly correlated and it always reverts back toward zero in the long run. These risk characteristics show that the term factor is reliably less risky than the market factor, and it diversifies the market factor.
Next we show that term and market factors explain multi-asset class portfolio risk.2 Northern Trust’s standard Moderate portfolio is comprised of 41% risk-control assets and 59% risk assets. Its risk-control subportfolio includes cash, investment-grade bonds, and inflation-protected bonds. Its risk-asset subportfolio includes high-yield bonds, US equity, developed international equity, emerging-market equity, natural resources, real estate and infrastructure. Since the common inception (December 2002) of indices that proxy for these asset classes to August 2024,3 the standard deviations for the risk-control and risk-asset subportfolios within the Moderate portfolio are 3.9% and 14.8%, respectively, and their correlation is 0.29. These risk characteristics are consistent with the history in Exhibits 1 and 2. They combine to produce a standard deviation for the Moderate portfolio of 9.4%.
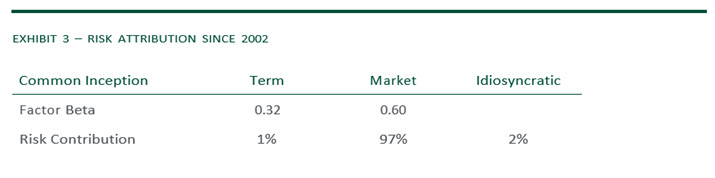
Exhibit 3 shows the risk attribution by factor since 2002. Although the Moderate portfolio has 10 asset classes, term and market factors explain 98% of its total risk. The betas measure the exposure or sensitivity to each factor. Notably the market factor contributes nearly all portfolio risk (97%) due to its higher standard deviation (and higher beta). In contrast, the term factor contributes very little to total portfolio risk (1%) due to both its lower standard deviation and low (diversifying) correlation. Idiosyncratic risk is the unexplained portion of total portfolio risk. It is small (2%) and generally uncompensated with an associated return premium – unlike term and market factors.
Next we evaluate the 3-year period ending August 2024, which includes the unexpected spike in inflation and bond yields. Over this difficult period for bonds, the standard deviations for risk-control and risk-asset subportfolios are 6.6% and 16.0%, respectively, which are higher than the prior example (since 2002) but still consistent with the history in Exhibit 1. However, their correlation is 0.78, which is high relative to the prior example and the history in Exhibit 2. These risk characteristics result in a standard deviation for the Moderate portfolio of 11.7%.
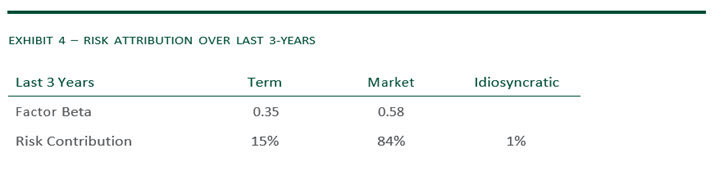
Exhibit 4 shows the risk attribution by factor over this 3-year period. Term and market factors explain 99% of the Moderate portfolio’s total risk. The market factor still contributes the vast majority of total portfolio risk (84%) due to its higher standard deviation (and higher beta). Despite the risk environment for bonds, the term factor contributes only a small portion of total portfolio risk (15%) due to its lower standard deviation and elevated but imperfect correlation.
Investors are more likely to succeed when they ignore short-term noise and focus on their long-term goals. For asset-only investors, the overall results show that risk-control assets (term factor) control total portfolio risk – which is dominated by the market factor – through both a lower standard deviation and generally low correlation. Building portfolios from risk-control, risk-asset building blocks is a far more reliable approach to risk management than building them solely from conventional asset classes or tactical market timing.
There are additional benefits for goals-based investors. The risk-control subportfolio is transformed into a goal hedge by employing high-grade, duration-matched bonds. The goal hedge can fully or partially secure an investor’s lifetime goals with minimal goal-relative risk, while the optimal risk-asset subportfolio can fund any unhedged portion of goals (and hold surplus assets). Perhaps ironically, a high correlation between the goal hedge and risk assets is actually beneficial because risk assets will then comove with goals just as the goal hedge does, further reducing goal-relative risk.
Asset allocation should rely on a sound theoretical foundation that is empirically valid and robust in practice. The risk-control, risk-asset framework represents the functional implementation of ICAPM portfolio theory.4 It provides a unified asset allocation framework for both asset-only and goals-based investors, with benefits that include better control over total portfolio risk, more robust diversification, and more reliable goal funding.
1 Treasury bonds are represented by Ibbotson Associates Intermediate Term Government Bond Index from January 1926 to April 2024 and then by Bloomberg US Treasury Bellwether 5-Year Index through August 2024. Stocks are represented by Ibbotson Associates Large Cap Stock Index from January 1926 to August 2024.
2 We use the Fama French developed market factor sourced from the Ken French Data Library and the Bloomberg US Treasury index minus IA SBBI US 30-Day Treasury Bills as the term factor for this attribution.
3 Asset classes are represented by the following indices: high-yield bonds – Bloomberg Global High Yield, U.S. equity – MSCI USA IMI, international developed equity – MSCI World ex USA IMI, emerging-market equity – MSCI Emerging Markets IMI, natural resources – S&P Global Natural Resources, global real estate – MSCI ACWI IMI Core RE, global infrastructure – S&P Global Infrastructure, US investment grade – Bloomberg US Aggregate, US inflation-protected – Bloomberg US Treasury Inflation Note 1-10 Year, and cash – FTSE T-Bill 3 Month.
4 See Mladina, “An ICAPM Framework for Asset Allocation,” The Journal of Portfolio Management (2023) for ICAPM theoretical, empirical and technical details. See Mladina and Grant, “An ICAPM for Goals-Based Investing,” The Journal of Wealth Management (2024) for ICAPM extensions to goals-based investing. See Mladina and Germani, “The Compensated Risk of Multi-Asset Portfolios,” The Journal of Portfolio Management (forthcoming) for ICAPM empirical evidence in multi-asset portfolios.

© 2025 Northern Trust Corporation. Head Office: 50 South La Salle Street, Chicago, Illinois 60603 U.S.A. Incorporated with limited liability in the U.S.
This document is a general communication being provided for informational and educational purposes only. The opinions and conclusions expressed herein are those of the authors and are not meant to be taken as investment advice or a recommendation for any specific investment product or strategy and does not take your financial situation, investment objective or risk tolerance into consideration. Performance examples are hypothetical and for illustration purposes only and actual results may be lower or higher than a portfolio that may be more or less diversified and/or managed in a different manner. In performing its services, Northern Trust will take into account other relevant facts and circumstances such that positions and transactions for any particular client account may differ with the investments described herein. Northern Trust provides fiduciary and investment management services to various types of accounts, including but not limited to, separately managed accounts, registered and unregistered funds. The investment advice given to one client account may differ from the investment advice given to another client account. Northern Trust and its affiliates may have positions in, and may effect transactions in, the markets, contracts and related investments described herein, which positions and transactions may be in addition to, or different from, those taken in connection with the investments described herein. All information discussed herein is current only as of the date of publication and is subject to change at any time without notice. This material has been obtained from sources believed to be reliable, but its accuracy, completeness and interpretation cannot be guaranteed. Readers, including professionals, should under no circumstances rely upon this information as a substitute for their own research or for obtaining specific legal, accounting or tax advice from their own counsel.
All investments involve risk and can lose value. The market value and income from investments may fluctuate in amounts greater than the market. Forecasts may not be realized due to a multitude of factors, including but not limited to, changes in economic conditions, corporate profitability, geopolitical conditions or inflation.
LEGAL, INVESTMENT AND TAX NOTICE. This information is not intended to be and should not be treated as legal, investment, accounting or tax advice.
PAST PERFORMANCE IS NO GUARANTEE OF FUTURE RESULTS. Periods greater than one year are annualized except where indicated. Returns of the indexes also do not typically reflect the deduction of investment management fees, trading costs or other expenses. It is not possible to invest directly in an index. Indexes are the property of their respective owners, all rights reserved.