- Who We Serve
- What We Do
- About Us
- Insights & Research
- Who We Serve
- What We Do
- About Us
- Insights & Research
Bracing for Impact
Tariff shocks are being cushioned — for now. But pressure on margins and prices may hit next.
KEY POINTS
What it is
This month’s perspective explores market reactions to new tariffs, funding market activity, and the resilience of high yield credit amid market uncertainty.
Why it matters
While near-term inflation may be delayed by inventory buffers, higher input costs and supply chain stress pose potential risks to corporate margins and consumer strength.
Where it's going
Our outlook is cautious but measured, favoring geographic diversification and credit quality as the market adapts to new macro and trade dynamics.
Timing: A Window of Opportunity… for Now. Unexpected wider and larger-scope tariff announcements have sent tremors through bond and equity markets, resulting in a brisk sell-off that signals investors’ caution. Companies, wary of the looming cost increases, are ramping up their activities in a bid to secure inventory before the higher tariffs take full effect. Recent months have witnessed record import orders as firms engage in a classic preemptive stockpiling maneuver. With an abundance of inventory to cushion the blow, the direct impact on retail pricing may be deferred by two-to-three months for consumers.
Magnitude: The Real Weight of Tariff Turbulence. Even as timing buffers offer a temporary reprieve, the magnitude of these tariff shocks looms ominously large. Both consumers and corporates have, over recent years, built up savings and resilience — stress-tested during the high inflation episodes of 2022. However, the numbers behind these tariffs tell a daunting story. In particular, the very high tariff rate of 145% imposed on Chinese goods is a stark cause for concern. While exemptions exist, early Goldman Sachs estimates indicate that substitutes are hard to come by for roughly 20-30% of these imports. For corporations that depend heavily on Chinese supply chains, this means that if the steep tariffs persist, businesses could face severe supply chain stress — a domino effect that would ripple outwards, affecting production schedules, profit margins, and ultimately, consumer prices.
Navigating a Dual-Edged Sword. The current scenario presents a dual-edged dilemma: on one side, the short-term deferral of higher costs due to preemptive stockpiling, and on the other, the potent risk of structural cost increases and supply chain disruptions in the medium to long term.
For consumers, the resilience built from prior periods of economic stress offers some comfort. However, once corporate inventories are exhausted and suppliers are forced to operate at the new cost levels, the anticipated surge in prices could quickly erode household spending power. It’s a classic case of deferred pain — the initial shock is absorbed by preemptive measures, but the real financial sting may come a few months down the line when the market adjusts to the tariff-imposed cost structure. Analysts will be keenly observing not only the immediate response from market participants but also the long-term adjustments in corporate supply chains. The adjustments, while potentially stabilizing in the long run, may trigger a period of volatility as the market adapts to a new, tariff-influenced reality.
What’s on the Radar? In conclusion, the dual factors of magnitude and timing in these tariff measures create a complex and unsettling landscape. For now, the strategic purchasing spree acts as a stop-gap measure, but once the buffer of abundant inventory is depleted, the full brunt of the tariff shock is likely to be felt. Investors and market participants will need to brace for a period of adjustment, watching carefully as supply chain stress and price increases set in over the coming months.
— Peter Wilke, CFA – Head of Tactical Asset Allocation, Global Asset Allocation
LIBERATION DAY SPIKE
The tariff announcements on Liberation Day increased expected volatility to levels of prior periods of market turmoil.
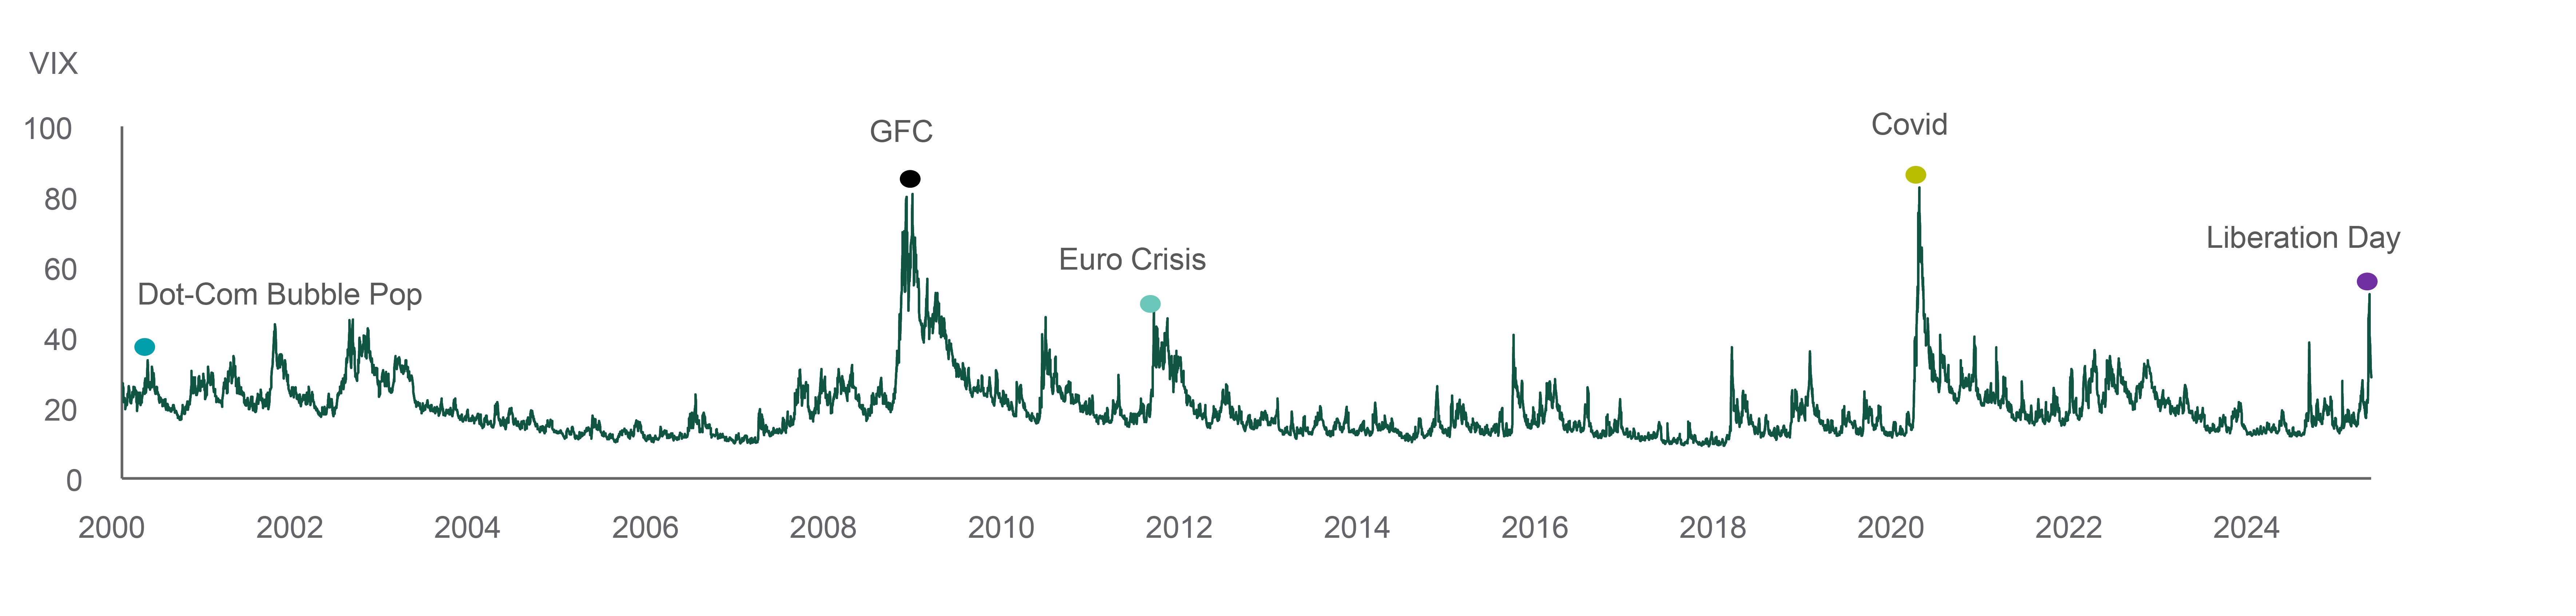
Source: Northern Trust Asset Management, Bloomberg. Data from 12/31/1999 through 4/14/2025. VIX = CBOE Volatility Index. Historical trends are not predictive of future results
Interest Rates
While there is plenty to monitor in financial markets currently, we continue to track balance sheet policy and money market conditions closely. Citing a desire for a “longer runway” to reduce the size of their balance sheet, the Fed halved the pace of balance sheet runoff at their March meeting, effective this month. While that adjustment didn’t have any immediate impact on market conditions, the next change in balance sheet policy is likely to be a conclusion to balance sheet reduction – a shift that may have more of an impact.
Meanwhile, the Secured Overnight Funding Rate (SOFR), an aggregation of repurchase agreement transactions and gauge of funding rates, has been volatile over the past several months. We consider this volatility perfectly normal within the target range. However, SOFR trading higher than the certain administered rate, or persistently near or above the top of the Federal Funds Target range, may be associated with stress in the funding markets with potential spillover into other asset classes. Accordingly we'll continue to monitor developments in these markets closely, as well as any feedback loop to balance sheet policy.
— Dan LaRocco, Head of U.S. Liquidity, Global Fixed Income
AN UPDATE ON SOFR
SOFR has been trading within the target range.
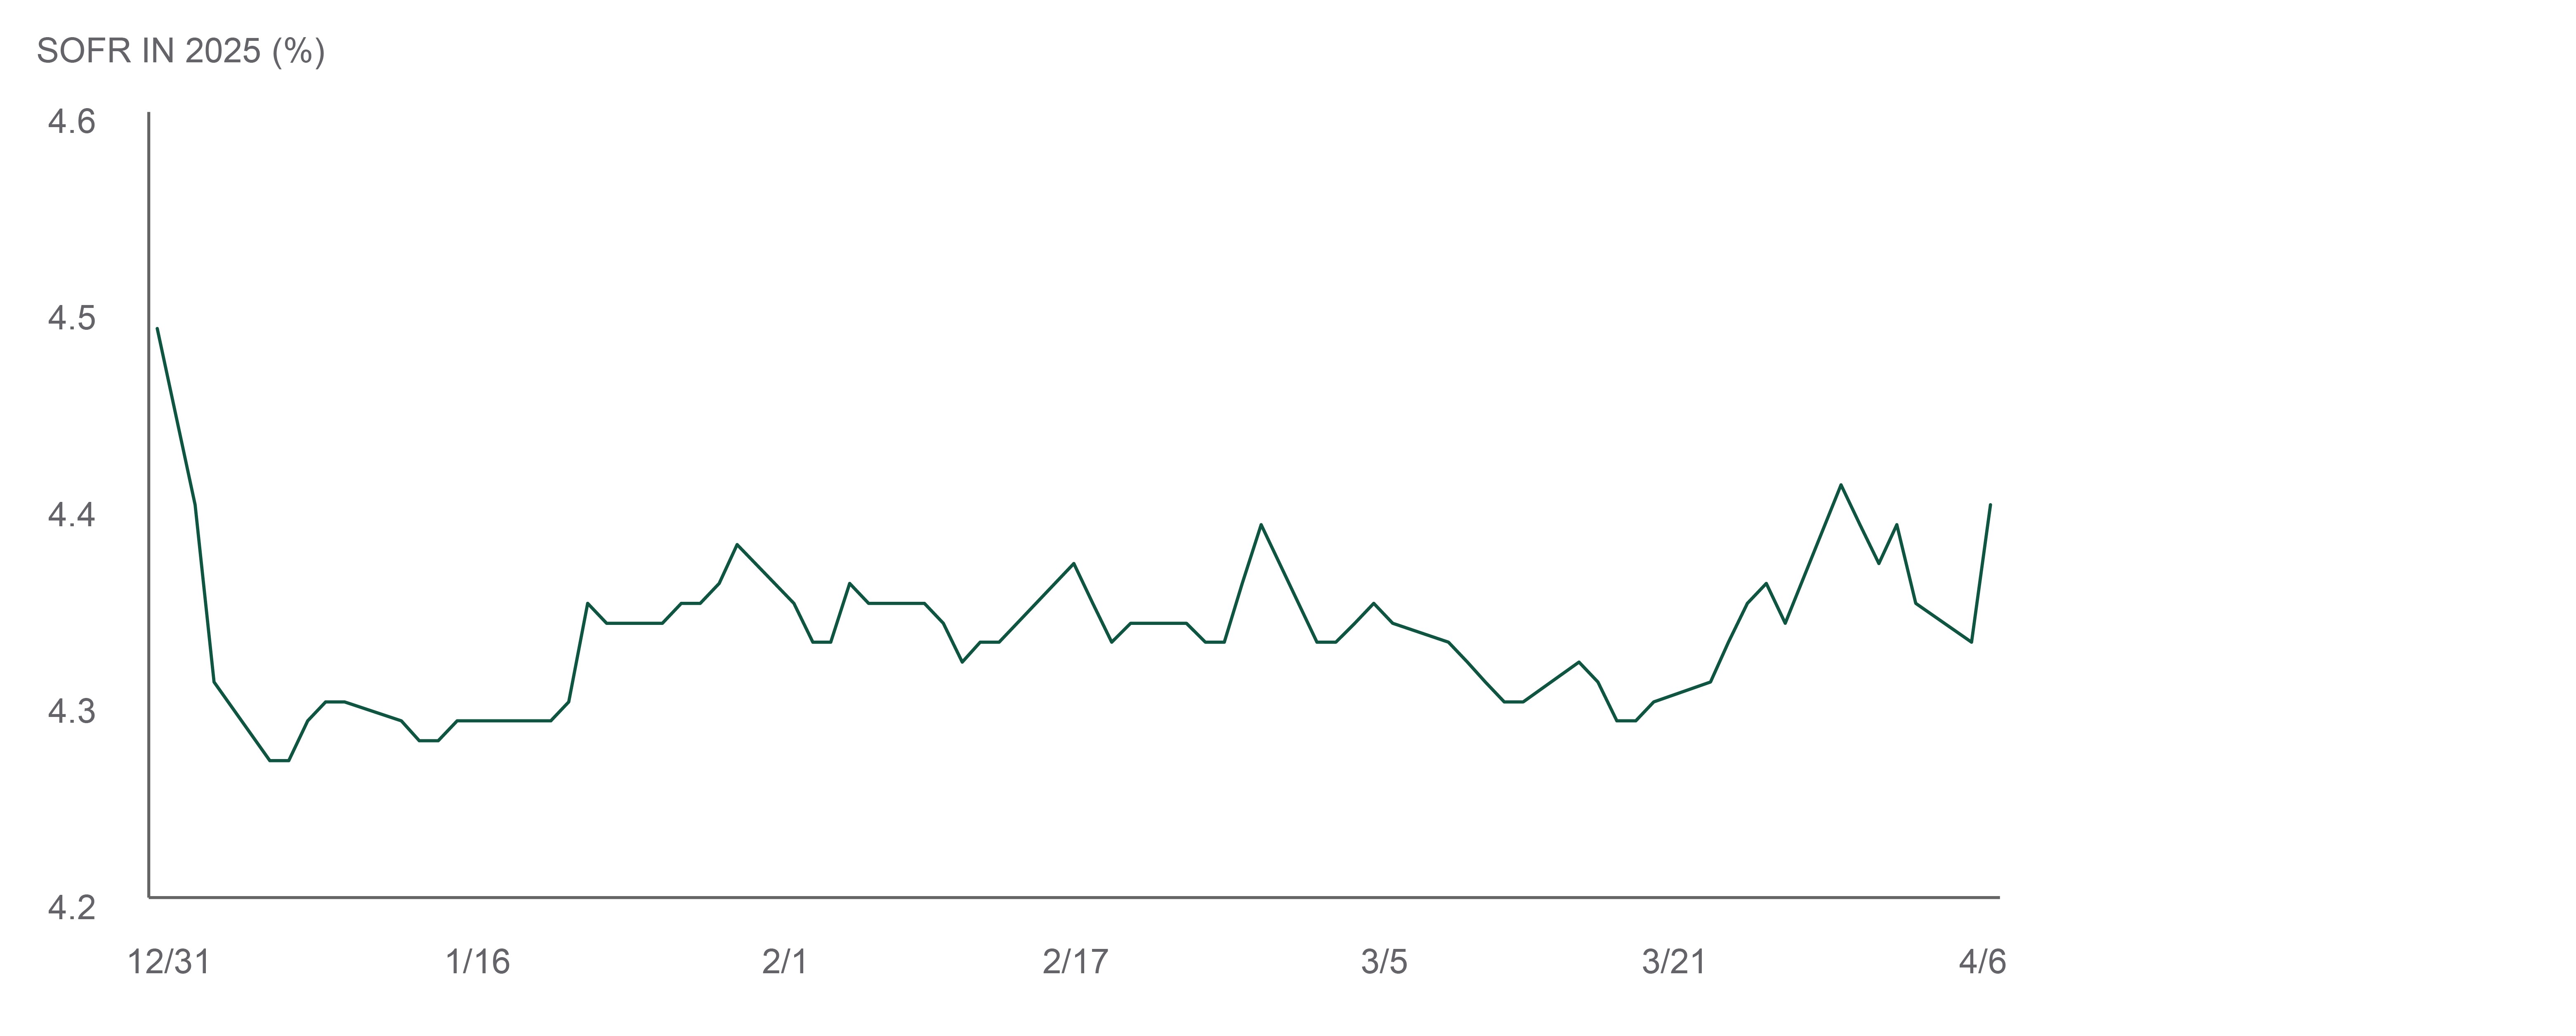
Source: Northern Trust Asset Management, Bloomberg. SOFR = Secured Overnight Financing Rate. Data from 12/31/2024 through 4/8/2025. Historical trends are not predictive of future results.
- Volatility within the target range for SOFR is normal.
- The Fed halved the pace of balance sheet reduction beginning this month.
- We continue to monitor money markets closely for signs of stress in fixed income markets.
Credit Markets
A constant stream of headlines drove risk asset performance in March, as heightened uncertainty from seemingly daily shifts in tariff policy caused the S&P 500 to have its largest monthly decline since December 2022. Despite recent market stress, credit fundamentals and technicals remain solid. Credit metrics for high yield for the fourth quarter have showed modest improvements off an already strong base. High yield issuers saw its first decline in leverage in four quarters with 15 of 18 sectors experiencing improvement.
Leverage metrics remain well below the long term average. Interest coverage has also improved for the first time in more than two years. High yield spreads (as of 4/8/25) have hit their highest level since October 2023 at 453 basis points (bps). The historical median 12-month forward total return for high yield with an index OAS range between 400-500 bps is 6.2% with a median excess return of 3.7%. While volatility could continue to be elevated in the short term, historically this has been an attractive entry point for a longer investment horizon.
—Ben McCubbin, Co-Head of High Yield, Global Fixed Income
—Sau Mui, Co-Head of High Yield, Global Fixed Income
VALUATIONS AND FORWARD RETURNS
Wider spreads can lead to higher future returns.
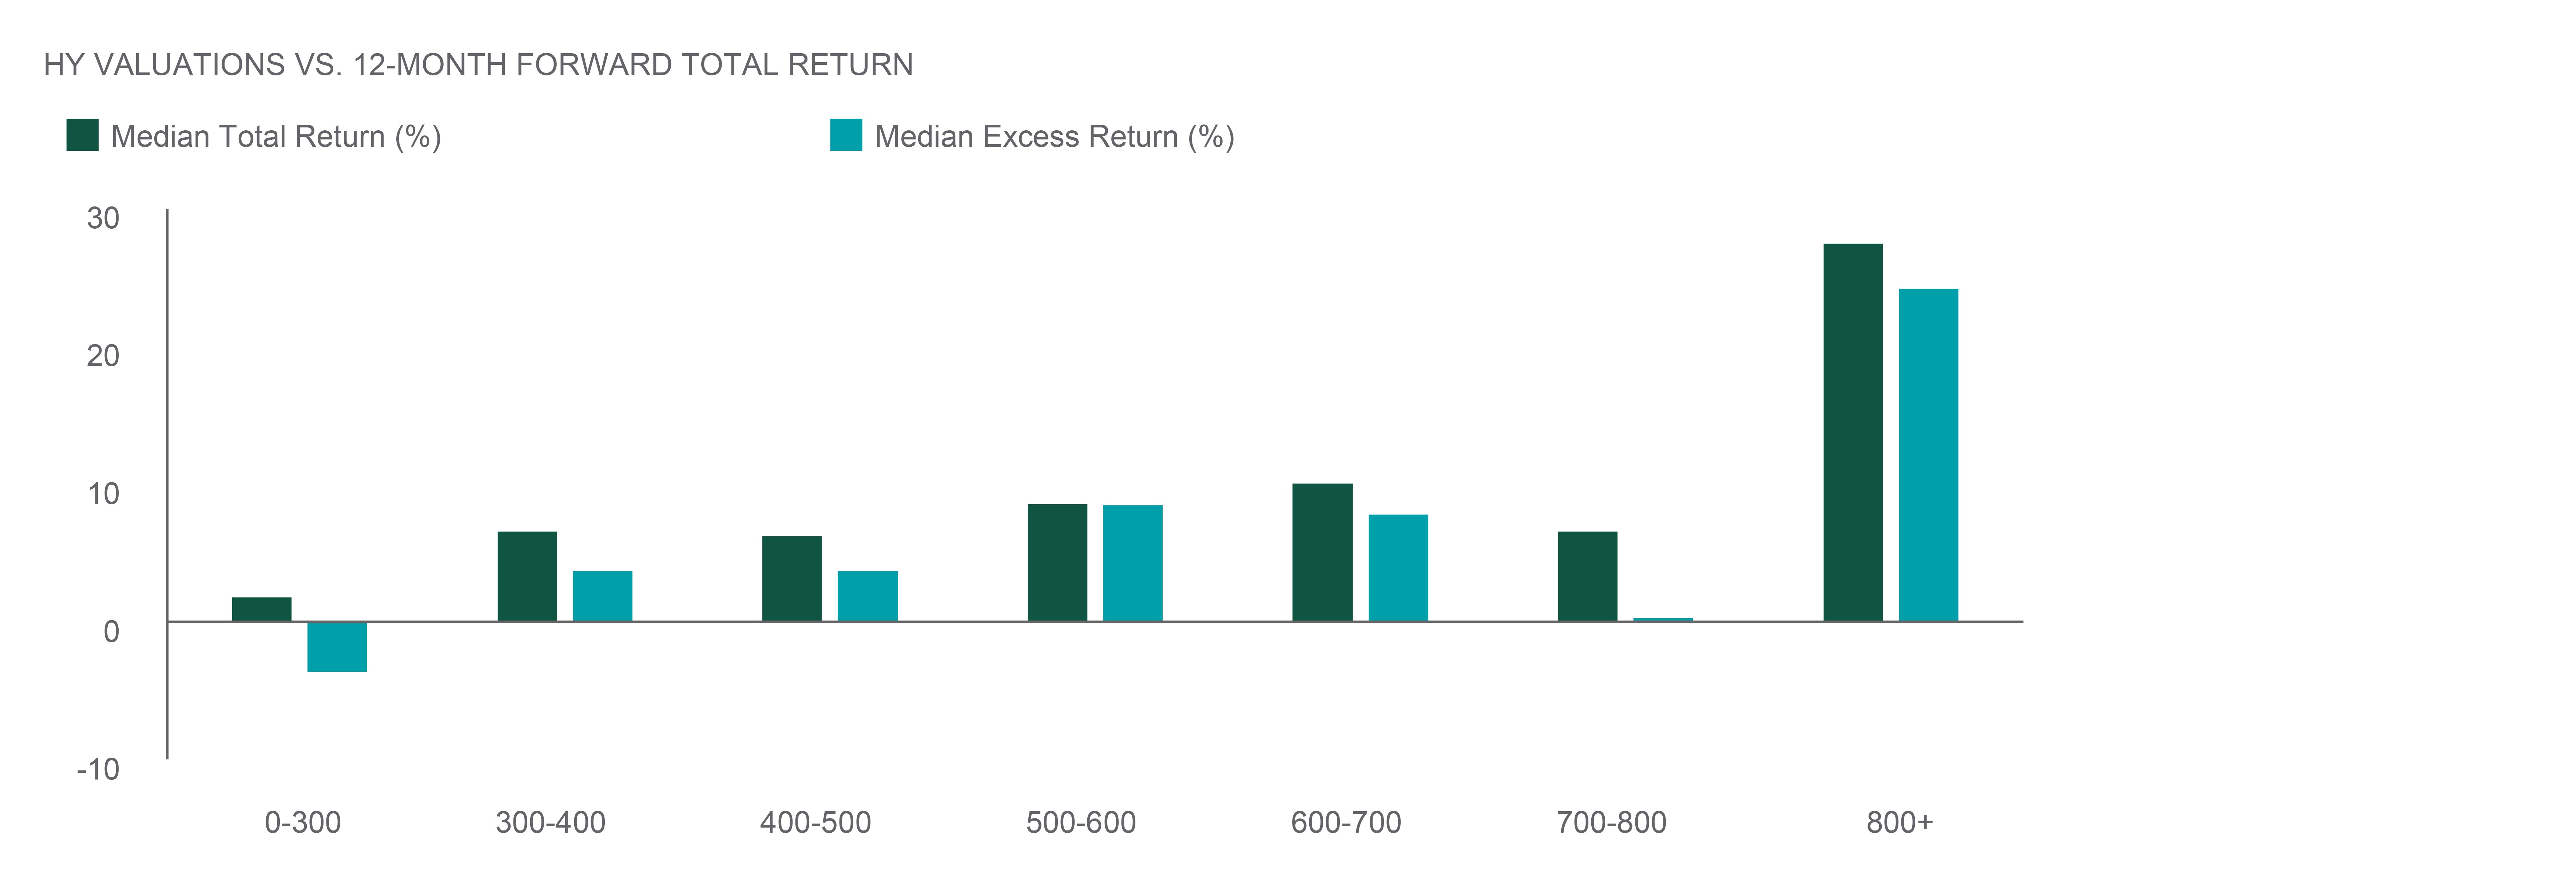
Source: Northern Trust Asset Management, Barclays Research. Data from 6/30/1996 through 3/31/2025. HY = High Yield. Historical trends are not predictive of future results.
- Credit metrics for high yield in the fourth quarter have showed modest improvement off of a strong base.
- High yield spreads (as of 4/8/25) have hit their highest level since October 2023 at 453 basis points (bps).
- The historical median 12-month forward total return for high yield with an index OAS range between 400-500 bps is 6.2% with a median excess return of 3.7%.
Equities
Since the end of February, U.S. large caps have declined 16.4% through April 8. An already wobbly equity market saw uncertainty hit a fever pitch following tariff details from April 2. In that time, defensive sectors have significantly outperformed cyclicals. Meanwhile, within both defensive and cyclical sectors, low risk stocks outperformed high risk stocks by a wide margin as investors flocked to safety. This dynamic across and within sectors was seen outside of the U.S. as well. Developed ex-U.S. and Emerging Markets held up well until April 2 before taking a significant downturn as the tariff retaliation cycle evolved.
Earlier in the year, large cap U.S. earnings were expect to grow around 11% year-over-year. That number has been thrown into serious doubt, and we expect to see negative analyst revisions. But the situation is highly fluid. Absent a significant pivot in trade policy, we expect a bigger shock to the U.S. macro picture. Despite increased recession odds, with U.S. equities already down around 20%, we decided to slightly trim the overweight. We also initiated a 2% overweight to Developed ex-U.S. equities, as we continue to see better opportunities there following recent approval of fiscal spending out of Europe.
— Jordan Dekhayser, Head of Equity Client Portfolio Management
RISK-OFF TRADE ACCELERATES
Defensive stocks and sectors take the leadership mantle.
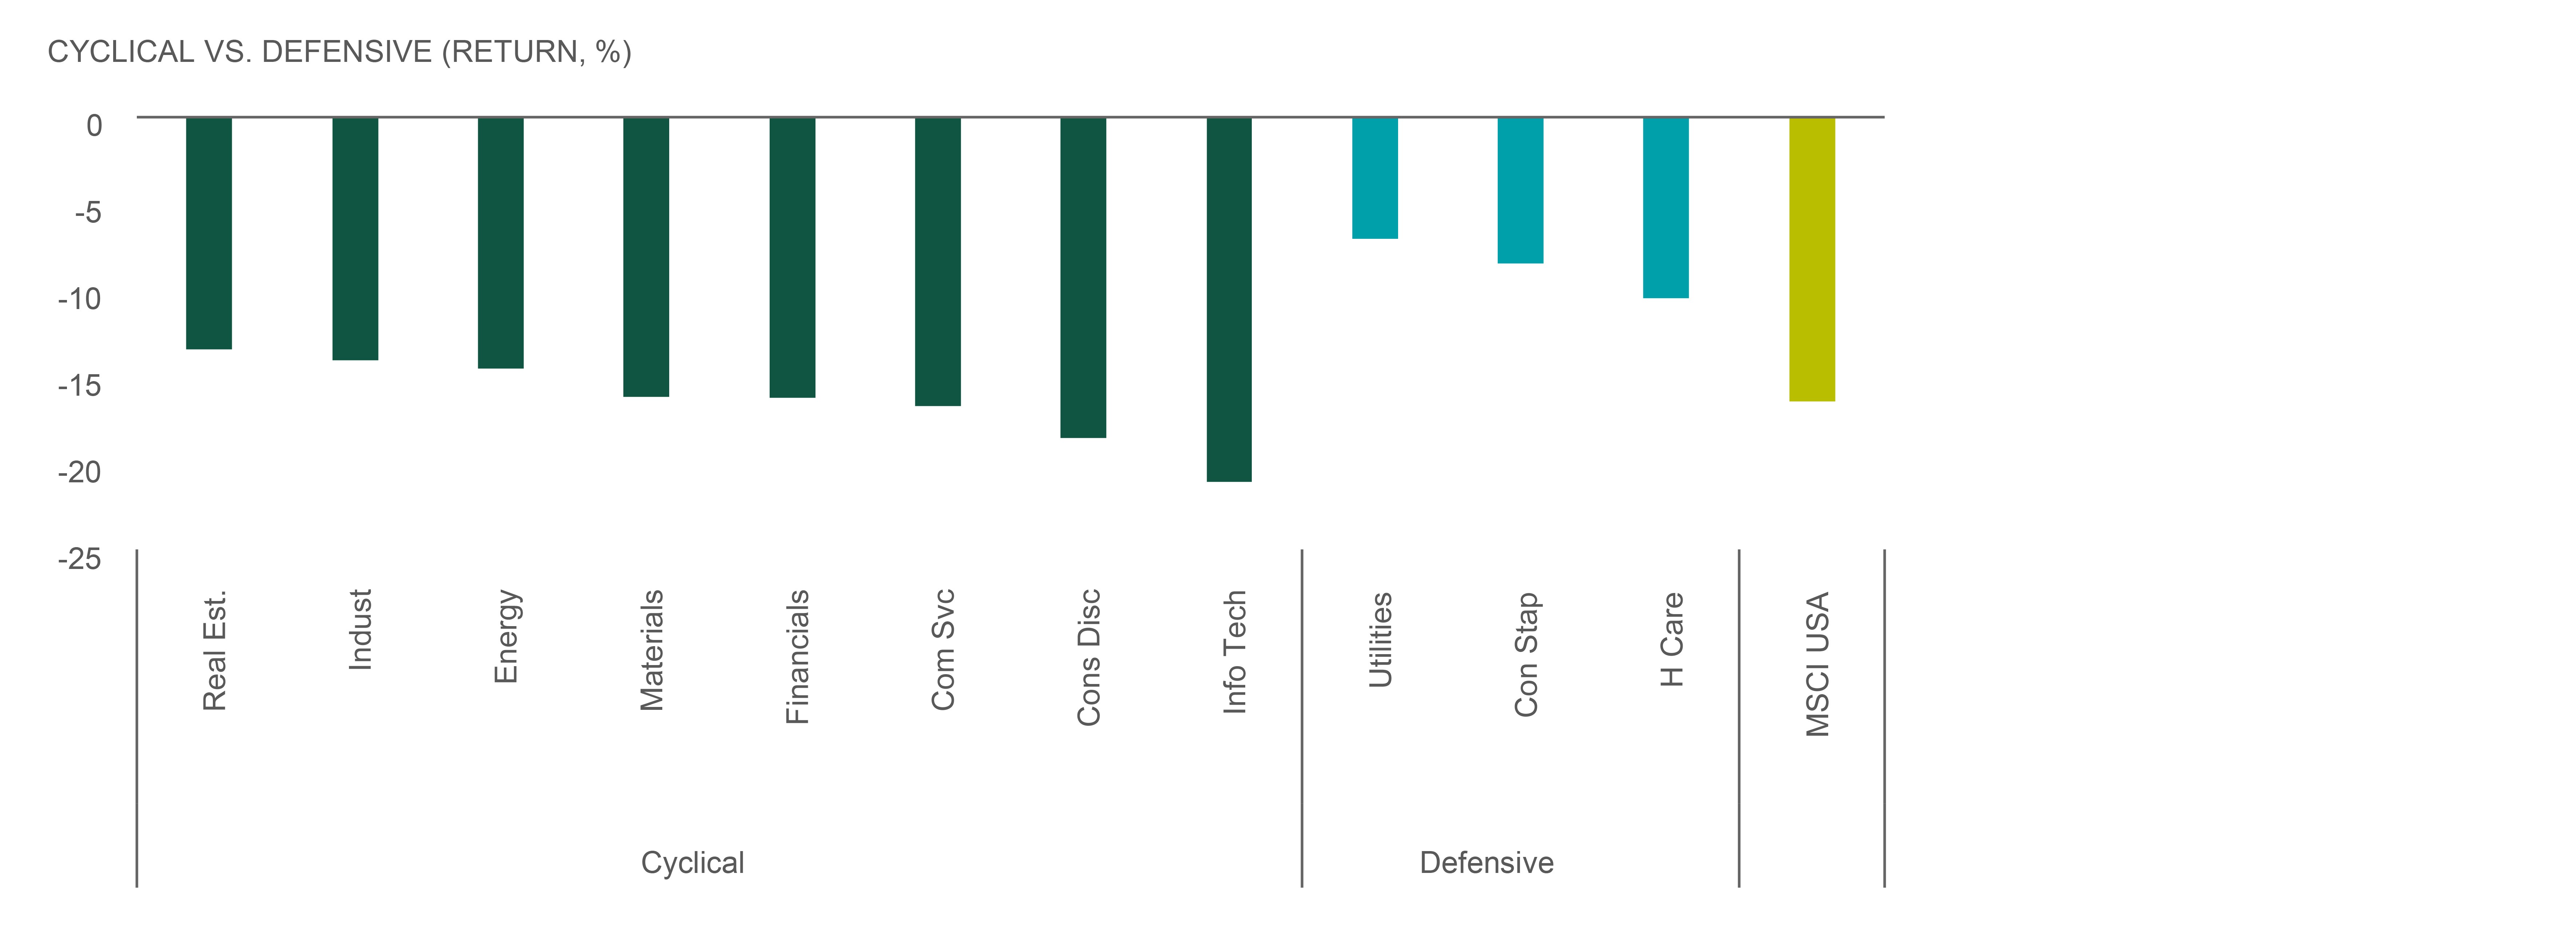
Source: Northern Trust Asset Management, MSCI. MSCI U.S. Sectors. Data from 2/28/2025 through 4/8/2025. Past performance is not indicative or a guarantee of future results. Index performance returns do not reflect any management fees, transaction costs or expenses. It is not possible to invest directly in any index.
- As risk picked up, defensive sectors and stocks outperformed during the sell-off.
- Developed ex-U.S. and Emerging Markets held up until April 2 when they too saw significant drawdowns.
- Despite increased recession odds, with U.S. equity markets already down around 20%, we slightly trimmed our U.S. equity overweight. We also initiated a 2% overweight to Developed ex-U.S. equities.
Real Assets
Given the rising macro volatility in the markets, we thought it would make sense to run through different economic scenarios for U.S. commercial real estate transaction volumes.
Consider a recessionary scenario of higher tariffs and lower net immigration leading to higher inflation and elevated interest rate volatility. The assumption in this scenario is that a recessionary environment would cause physical office utilization to wane as companies look to reduce costs. In this scenario, the expectation is that transaction volumes decline over the course of 2025 as the economy worsens, but still keep up with results from a depressed 2024. The expectation for 2026 would be macroeconomic pressure leads to an approximately 20% reduction in transaction volumes.
Next, we assess a more stable scenario with positive U.S. real GDP growth and moderate tariff impacts. We would expect relatively stable rates, job growth and stronger office occupancy. In this scenario, investors should expect transaction volumes to rally around 15% in 2025 off of lower 2024 volumes and then another 7% in 2026.
— Jim Hardman, Head of Real Assets, Multi-Manager Solutions
CRE STRESS TEST
U.S. Commercial Real Estate transaction volumes are expected to be impacted by macroeconomic factors.
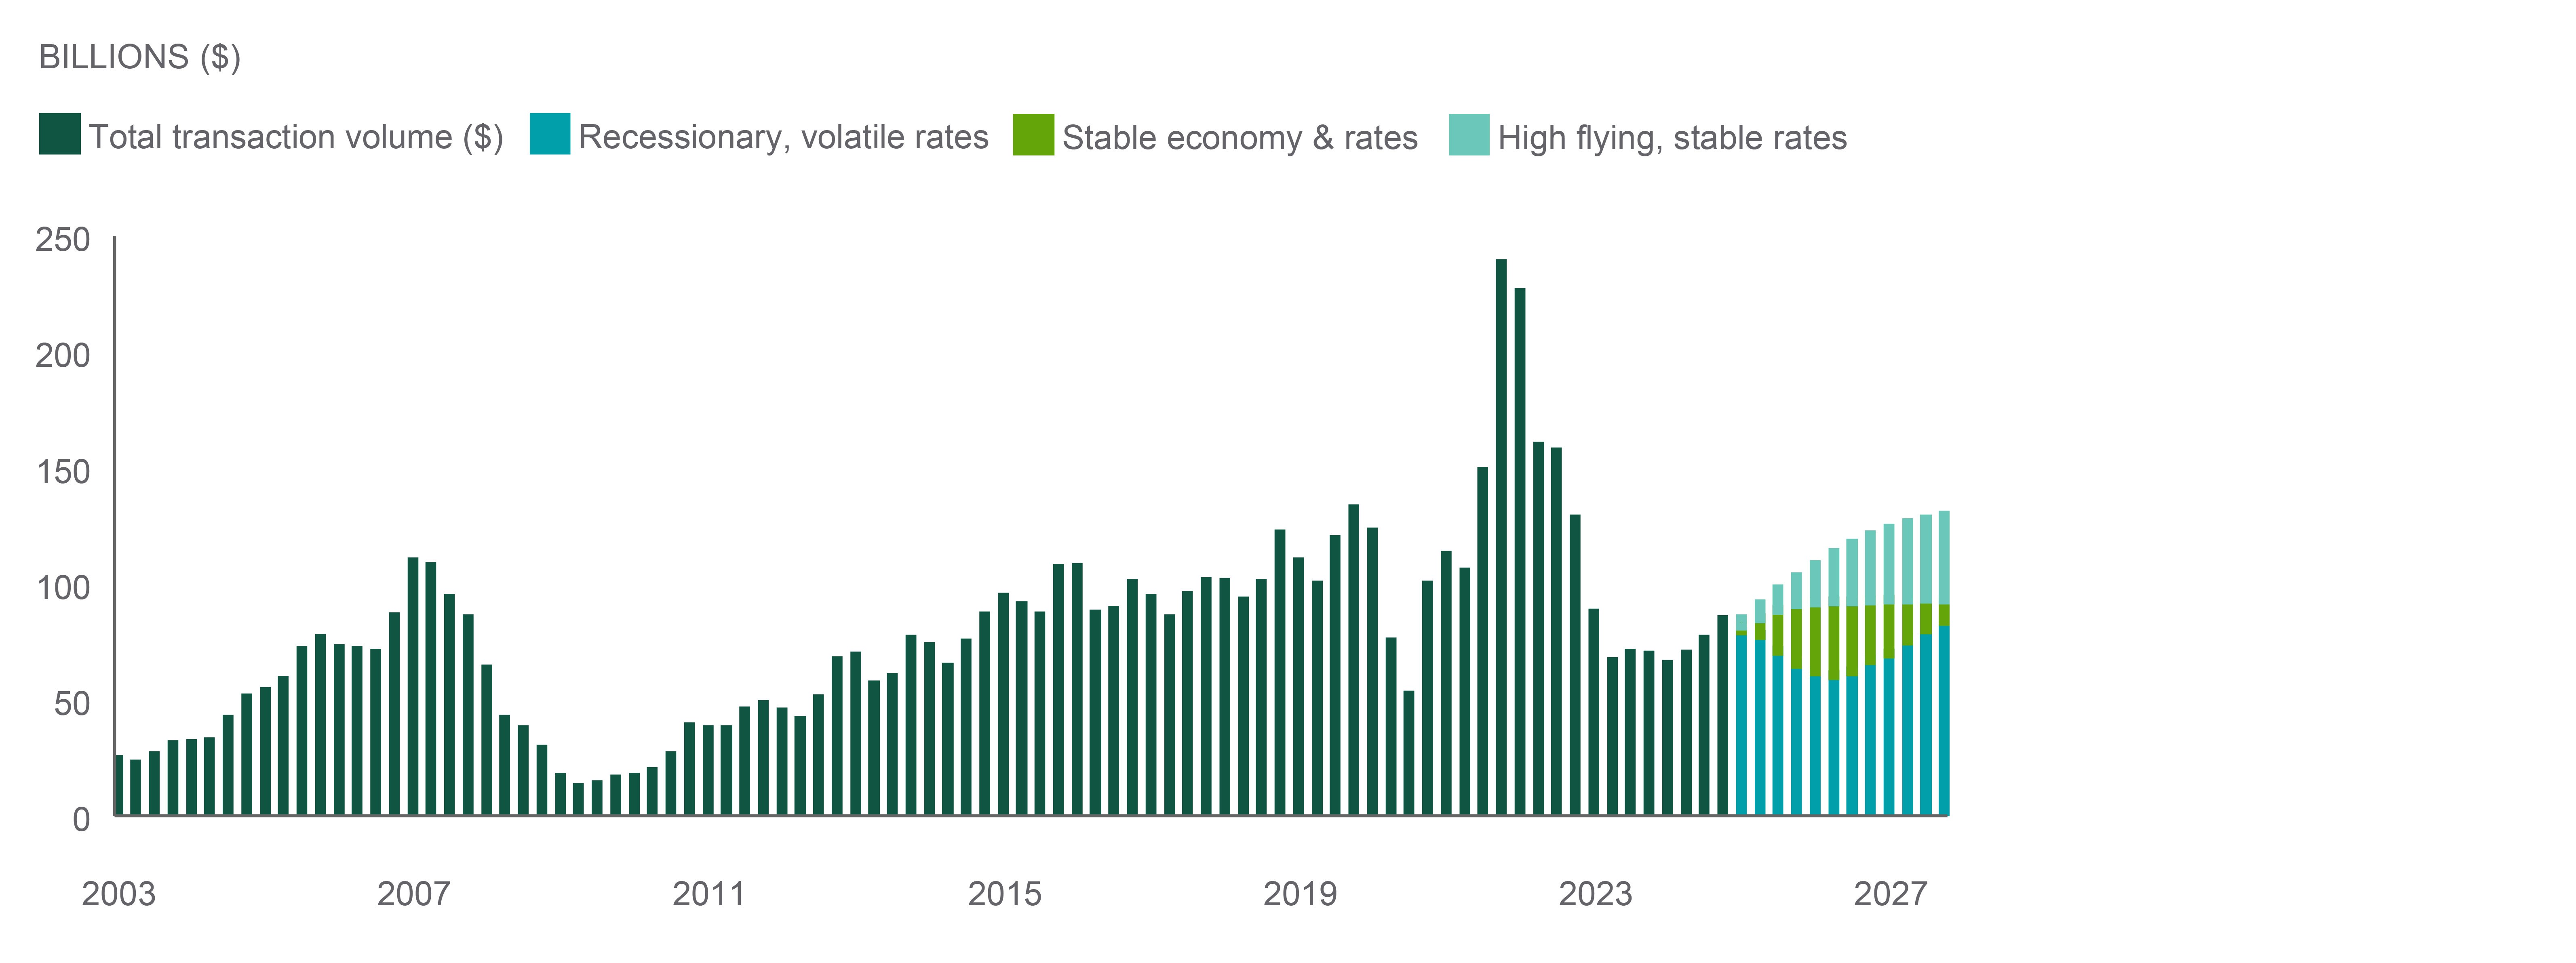
Source: Northern Trust Asset Management, FactSet, Kastle, Haver Analytics, Goldman Sachs. Total transaction volume includes Office, Industrial, and Multifamily transaction volumes. Historical data from 12/31/2002 through 12/31/2024. Estimates from 12/31/2025 through 12/31/2027. Historical data and estimates are quarterly. Historical trends are not predictive of future results.
- For real assets, we believe it prudent to assess distinct economic scenarios in this environment.
- We confirm our equal weight to real estate on stable fundamentals, fair valuations, and expectations of accretive external growth.
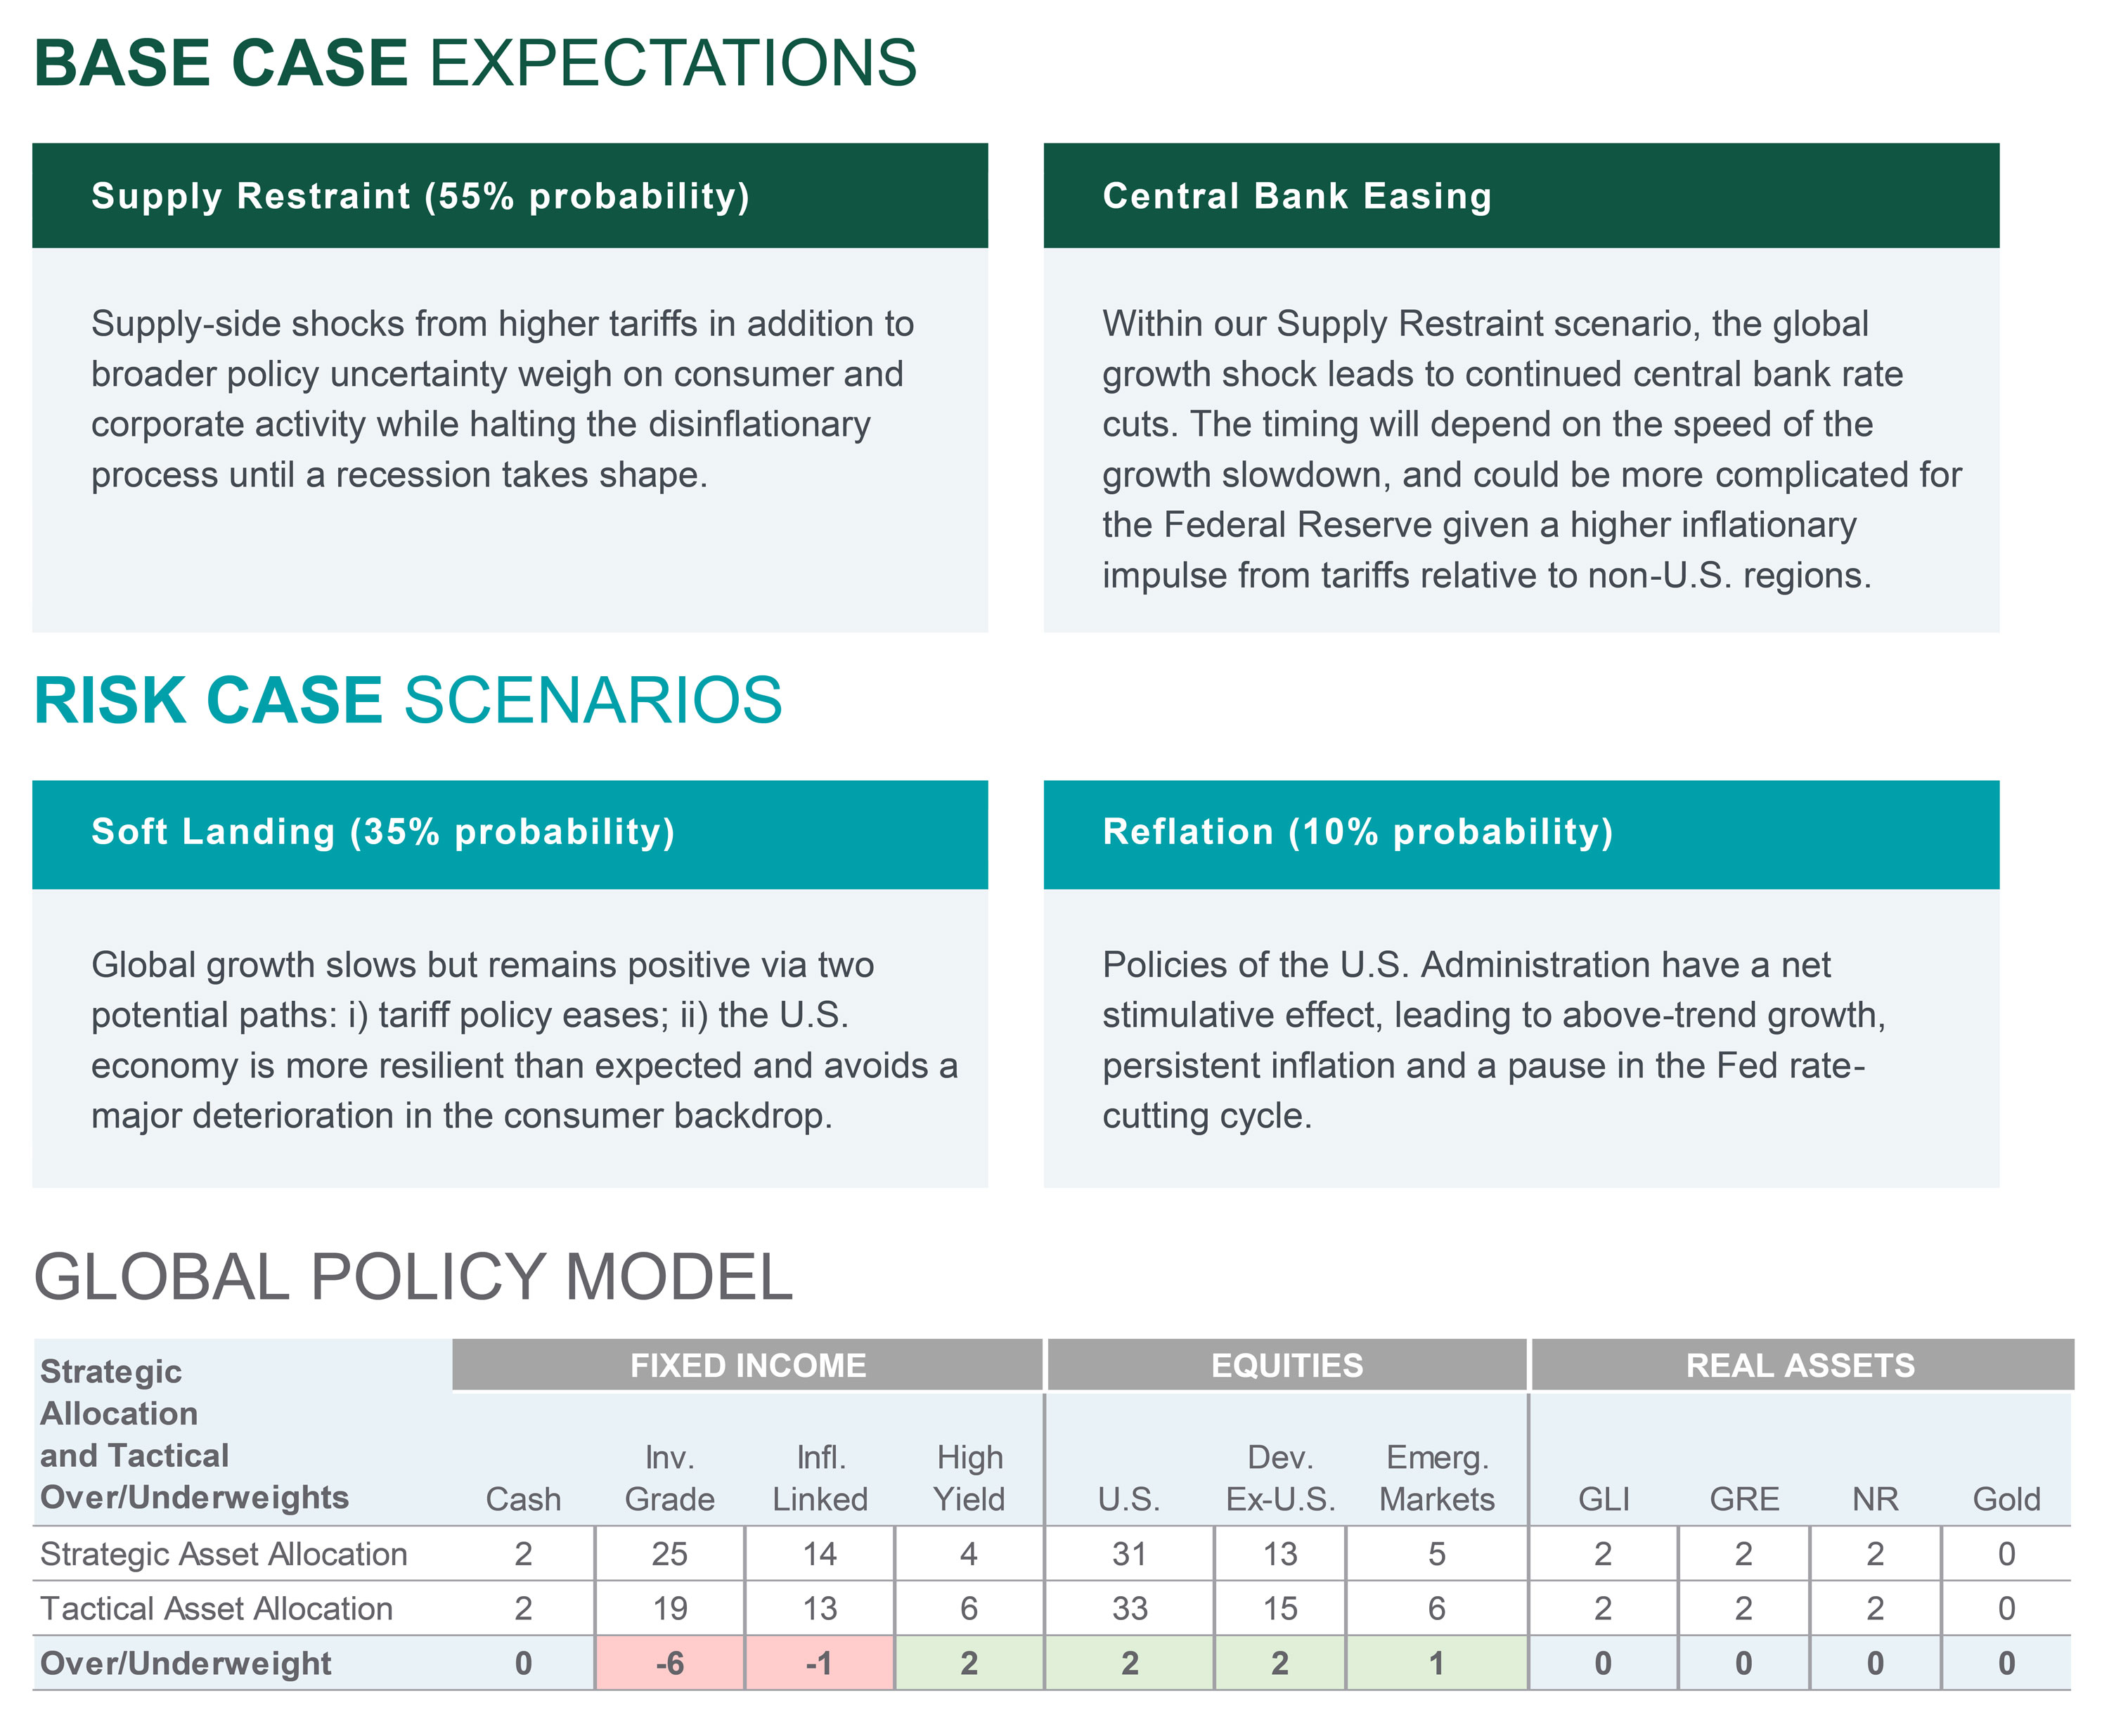
Source: Northern Trust Capital Market Assumptions Working Group, Investment Policy Committee. Strategic allocation is based on capital market return, risk and correlation assumptions developed annually; most recent model released 1/15/2025.The model cannot account for the impact that economic, market and other factors may have on the implementation and ongoing management of an actual investment strategy. Asset allocation does not guarantee a profit or protection against a loss in declining markets. GLI = Global Listed Infrastructure, GRE = Global Real Estate, NR = Natural Resources. Unless otherwise noted, the statements expressed herein are solely opinions of Northern Trust. Northern Trust does not make any representation, assurance, or other promise as to the accuracy, impact, or potential occurrence of any events or outcomes expressed in such opinions.
Unless noted otherwise, data on this page is sourced from Bloomberg as of April 2025.
IMPORTANT INFORMATION
Northern Trust Asset Management (NTAM) is composed of Northern Trust Investments, Inc., Northern Trust Global Investments Limited, Northern Trust Fund Managers (Ireland) Limited, Northern Trust Global Investments Japan, K.K., NT Global Advisors, Inc., 50 South Capital Advisors, LLC, Northern Trust Asset Management Australia Pty Ltd, and investment personnel of The Northern Trust Company of Hong Kong Limited and The Northern Trust Company.
Issued in the United Kingdom by Northern Trust Global Investments Limited, issued in the European Economic Association (“EEA”) by Northern Trust Fund Managers (Ireland) Limited, issued in Australia by Northern Trust Asset Management (Australia) Limited (ACN 648 476 019) which holds an Australian Financial Services Licence (License Number: 529895) and is regulated by the Australian Securities and Investments Commission (ASIC), and issued in Hong Kong by The Northern Trust Company of Hong Kong Limited which is regulated by the Hong Kong Securities and Futures Commission.
For Asia-Pacific (APAC) and Europe, Middle East and Africa (EMEA) markets, this information is directed to institutional, professional and wholesale clients or investors only and should not be relied upon by retail clients or investors. This information may not be edited, altered, revised, paraphrased, or otherwise modified without the prior written permission of NTAM. The information is not intended for distribution or use by any person in any jurisdiction where such distribution would be contrary to local law or regulation. NTAM may have positions in and may effect transactions in the markets, contracts and related investments different than described in this information. This information is obtained from sources believed to be reliable, its accuracy and completeness are not guaranteed, and is subject to change. Information does not constitute a recommendation of any investment strategy, is not intended as investment advice and does not take into account all the circumstances of each investor.
This report is provided for informational purposes only and is not intended to be, and should not be construed as, an offer, solicitation or recommendation with respect to any transaction and should not be treated as legal advice, investment advice or tax advice. Recipients should not rely upon this information as a substitute for obtaining specific legal or tax advice from their own professional legal or tax advisors. References to specific securities and their issuers are for illustrative purposes only and are not intended and should not be interpreted as recommendations to purchase or sell such securities. Indices and trademarks are the property of their respective owners. Information is subject to change based on market or other conditions.
All securities investing and trading activities risk the loss of capital. Each portfolio is subject to substantial risks including market risks, strategy risks, advisor risk, and risks with respect to its investment in other structures. There can be no assurance that any portfolio investment objectives will be achieved, or that any investment will achieve profits or avoid incurring substantial losses. No investment strategy or risk management technique can guarantee returns or eliminate risk in any market environment. Risk controls and models do not promise any level of performance or guarantee against loss of principal. Any discussion of risk management is intended to describe NTAM’s efforts to monitor and manage risk but does not imply low risk.
Past performance is not a guarantee of future results. Performance returns and the principal value of an investment will fluctuate. Performance returns contained herein are subject to revision by NTAM. Comparative indices shown are provided as an indication of the performance of a particular segment of the capital markets and/or alternative strategies in general. Index performance returns do not reflect any management fees, transaction costs or expenses. It is not possible to invest directly in any index. Net performance returns are reduced by investment management fees and other expenses relating to the management of the account. Gross performance returns contained herein include reinvestment of dividends and other earnings, transaction costs, and all fees and expenses other than investment management fees, unless indicated otherwise. For U.S. NTI prospects or clients, please refer to Part 2a of the Form ADV or consult an NTI representative for additional information on fees.
Hypothetical portfolio information provided does not represent results of an actual investment portfolio but reflects representative historical performance of the strategies, funds or accounts listed herein, which were selected with the benefit of hindsight. Hypothetical performance results do not reflect actual trading. No representation is being made that any portfolio will achieve a performance record similar to that shown. A hypothetical investment does not necessarily take into account the fees, risks, economic or market factors/conditions an investor might experience in actual trading. Hypothetical results may have under- or over-compensation for the impact, if any, of certain market factors such as lack of liquidity, economic or market factors/conditions. The investment returns of other clients may differ materially from the portfolio portrayed. There are numerous other factors related to the markets in general or to the implementation of any specific program that cannot be fully accounted for in the preparation of hypothetical performance results. The information is confidential and may not be duplicated in any form or disseminated without the prior consent of (NTI) or its affiliates.
Forward-looking statements and assumptions are NTAM’s current estimates or expectations of future events or future results based upon proprietary research and should not be construed as an estimate or promise of results that a portfolio may achieve. Actual results could differ materially from the results indicated by this information.
Not FDIC insured | May lose value | No bank guarantee