- Who We Serve
- What We Do
- About Us
- Insights & Research
- Who We Serve
- What We Do
- About Us
- Insights & Research
What to Expect in U.S. Markets During a U.S. Presidential Election
While there is uncertainty in any contested election, the upcoming U.S. presidential election is already full of twists and turns and there are probably more surprises to come. I want to therefore examine how previous presidential elections impacted U.S. capital markets, with an eye on how this year is similar and different.
As the market has been incorrectly predicting interest rate cuts for over a full year, let’s begin with FOMC behavior during election years. At present, the market is anticipating between two and three cuts over the back half of the year, with the first cut likely coming at the September 18th FOMC meeting, less than two months before the date of the election. Many market pundits have suggested that the Fed will be reticent to cut during a politically sensitive time. The view is that, consistent with the broader trend, the Federal Reserve is being politicized and may wish to lay low until the presidential election is over. What does history suggest?
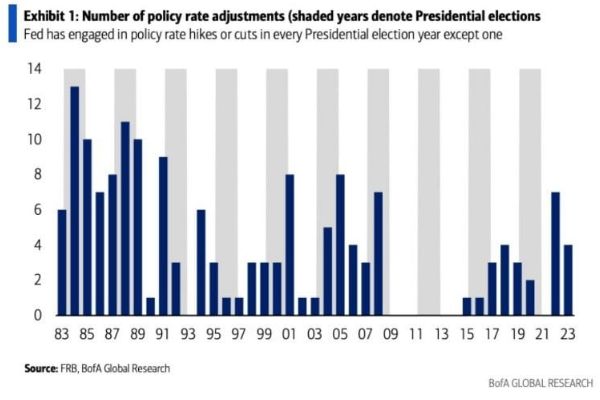
Graphic 1A: FOMC Policy Cuts since 1983; Source: BofA
In every single election year for the past 40 years except for the one in 2012, the FOMC has increased or decreased interest rates. Therefore the view that the Fed will wait until after November to begin cutting is likely unfounded. If the data indicating slowing growth and moderating inflation continues, then the Fed may begin cutting rates at the September meeting preceding the election, as the market is indicating presently.
Barclays went one step further and compared historic Fed Fund rates to the Taylor Rule, which approximates the optimal level or interest rates based upon prevailing views on the economy.
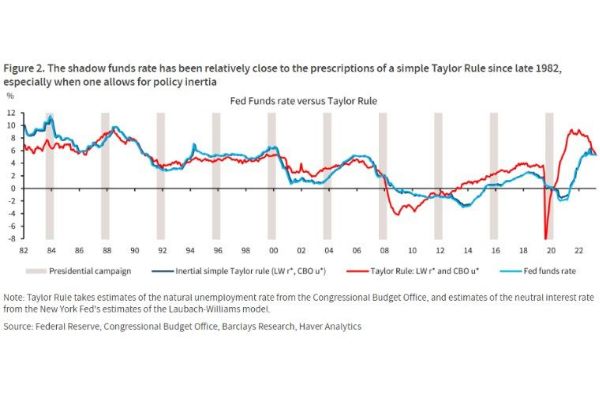
Graphic 1B: Fed Funds Vs Taylor Rule; Source: Barclays
The comparison of FOMC policy rates to the Taylor Rule yielded no discernible deviation, Barclays concluded. They further suggested no statistical aberrations in Fed Policy are apparent during election year. This analysis indicates that the Fed, at least historically, has operated with some degree of impartiality. Any rate decision made and announced on September 18th will hopefully be data-based. The CPI report due out precisely one week earlier, on September 11th, will be closely watched.
In the stock market, historically, investors have shied away from U.S. equities in the months leading up to presidential elections. And after the election, investors have shifted back into equities. The below graphic, published by Goldman Sachs earlier this year, depicts U.S. equity fund flows over the prior five elections.
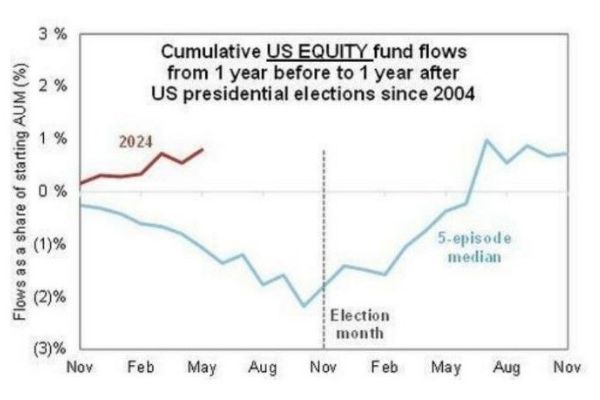
Graphic 2: U.S. Equity Fund Flows in Election Years Since 2004; Source: Goldman Sachs
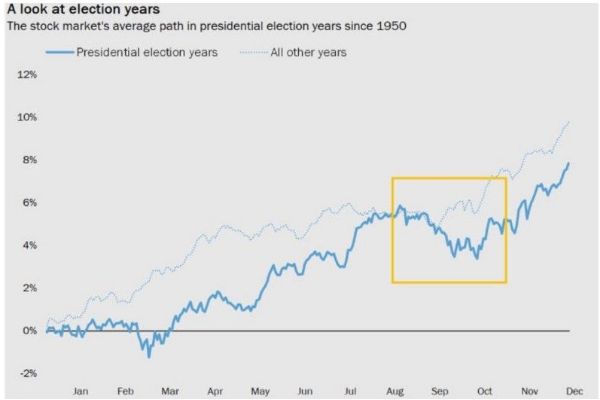
This trend of declining/rising equity allocations before/after the election is also evident in performance, shown in the graphic below from Barclays which examines S&P 500 movements during election years.
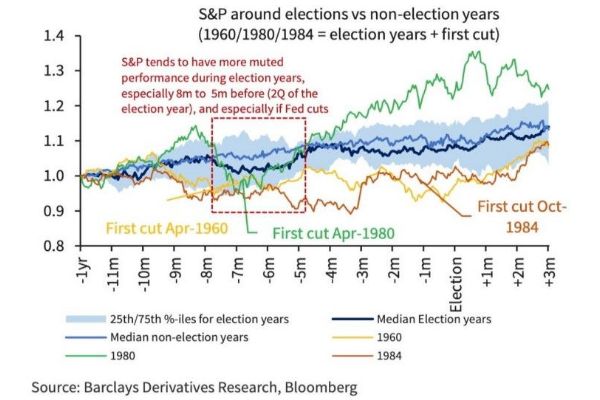
Graphic 3: S&P 500 Performance in Election Years; Source: Barclays
In this graphic, Barclays also looks at years in which the FOMC was beginning interest rate cuts. They conclude that U.S. equity performance is usually weaker earlier in the election year, especially in a rate cutting environment.
We are actually seeing the opposite in 2024, as the equity market has continued to attract fresh capital, particularly from U.S. retail investors and foreign investors. The S&P 500 price movement bucked the trend at the start of the year with a very strong first quarter. However, the softness in the second quarter in April seems to coincide with the muted performance noted in Graphic 3 above.
Below is a cleaner look at performance during presidential Election years. The second graph removes the 2008 election year, which was impacted far more by the global financial crisis than the presidential election in particular year.
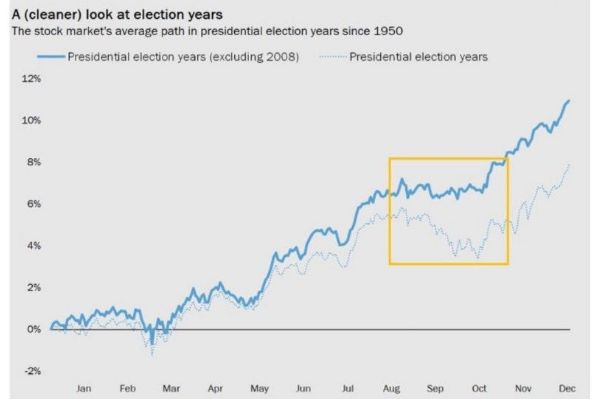
Graphic 4: S&P 500 Index Movement in Election Years; Source: OptimistiCallie
The next graphic from LPL Research differentiates average performance during each year of the four year presidential cycle going back to 1952. Historically, the best returns in an election year occur when a new President is elected. Markets tend to react far less enthusiastically to a re-elected President.
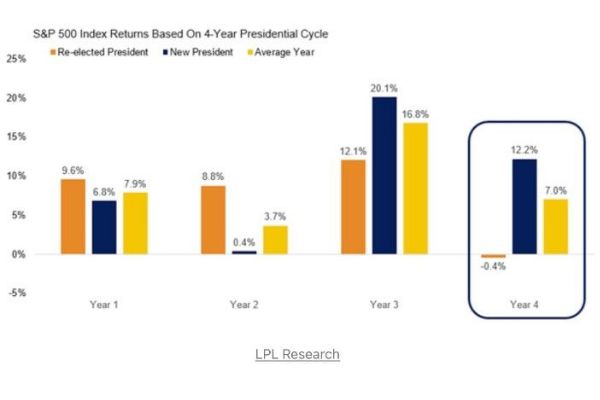
Graphic 5: S&P 500 Annual Returns by Presidential Cycle Year; Source: LPL Research
In presidential election years, volatility tends to pick up as well. From July to November, VIX increases on average about 25%. The graphic below from BofA Global Research includes all election years since Herbert Hoover defeated Al Smith in 1928, using realized volatility in the years before VIX was calculated.
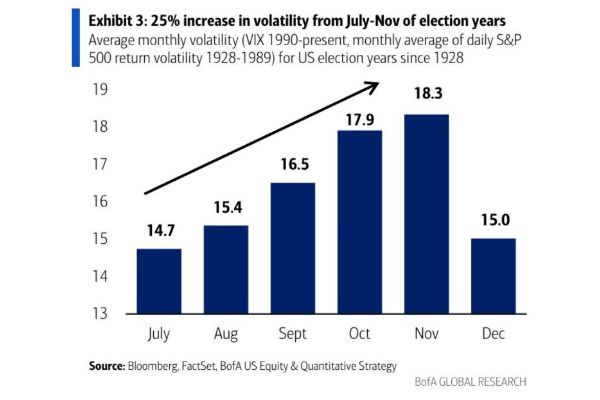
Graphic 6: S&P 500 Volatility in Election Years; Source: BofA
Given the very strong equity year the S&P 500 enjoyed in 2023, we should also consider similar situations when market returns were strong before an election year. There have been eight times when the S&P 500 Index returns exceeded 20% in the year prior to electing a president:
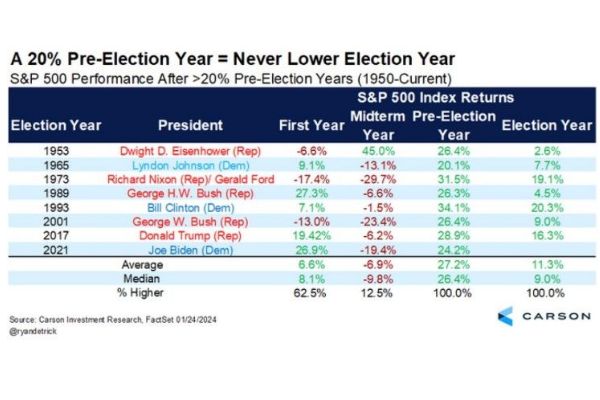
Graphic 7: S&P 500 Performance in Election Years after 20% Gains in Prior Year; Source: Carson Investment Research
Surprisingly, in 100% of these instances, the S&P 500 was higher in the election year following such strong prior-year gains. The real risk is falling equity markets two years later during mid-terms, when the S&P 500 was soft all but one time.
In bond markets, investment grade credit spreads tend to widen in the beginning of the year but tighten as the presidential election draws near. The graphic below from Siebert Williams Shank illustrates both IG Bond performance as well as spread movement over the past several election cycles.
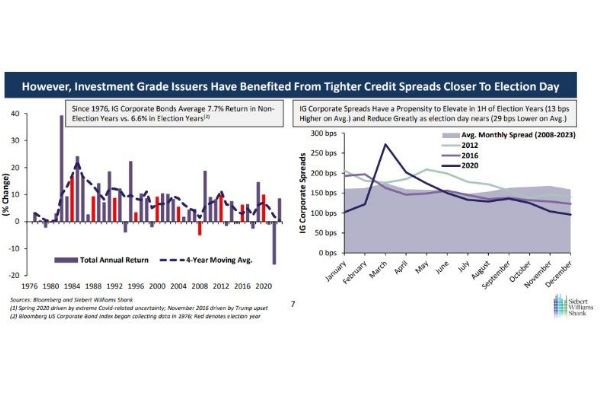
Graphic 8: IG Credit Performance in Election Years; Source: Siebert Williams Shank
In 2024, we have seen the opposite. IG credit spreads have tightened since the beginning of the year until widening slightly in recent weeks. Moreover, new issuance has been well received by the market, as corporate balance sheets and profit margins remain healthy.
Generally speaking, Treasury issues are popular headed into a presidential election. And 2024 is proving no different here. Other than a couple of auctions that were met with softer than expected demand, investors are still favorable on buying Treasury securities despite the increases as issuance of the U.S. fiscal debt continues to rise rapidly.
Unsurprisingly, in 2024 investors seem to expect volatility to be higher than usual this year. The graphic below shows VIX futures differential between October and September for 2024 compared to the prior three elections. Compared to prior elections, traders anticipate more volatility and uncertainty in 2024.
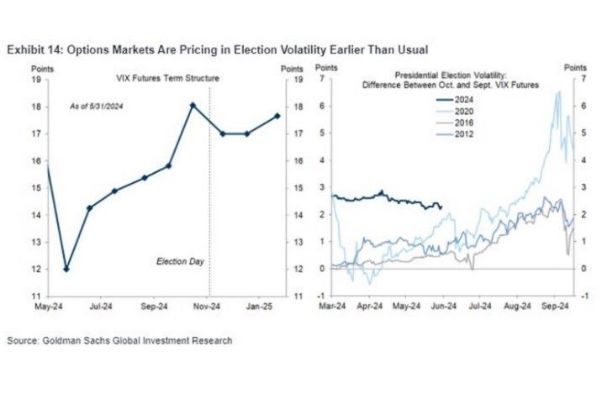
Graphic 9: VIX Futures in 2024; Source: Goldman Sachs
Yet despite the many unknowns and expected higher volatility, few investors appear to be hedging themselves, at least not thus far. The cost to hedge today is very low, owing to strong bullish sentiment expressed by options traders, and the relative cost of buying puts is historically cheap.
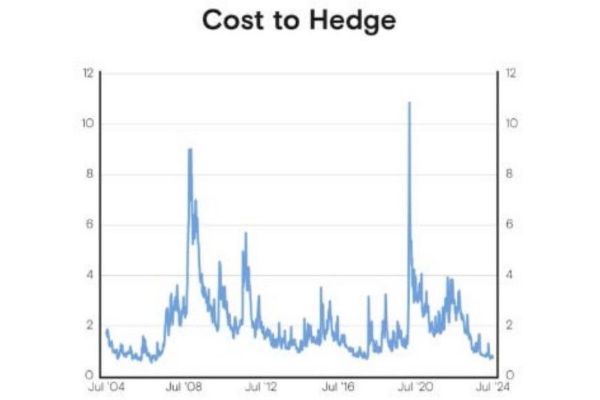
Graphic 10: S&P 500 Hedging Cost as a Percentage of Portfolio; Source: Goldman Sachs
Lastly, Barclays points out some interesting price action when Donald Trump was elected in 2016. Immediately after his surprise win in November 2016, tech underperformed. We tend to forget this performance blip because tech came back so strong in 2017 and through the pandemic. Yet we just witnessed some similar price movements, with tech and mega cap tech selling off as Trumps polling numbers improved.
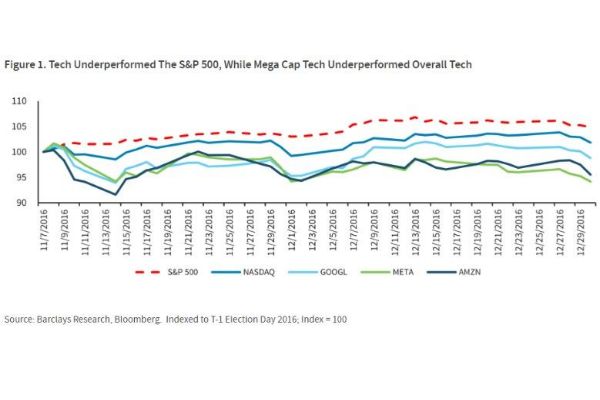
Graphic 11: Performance of Tech in Aftermath of Trump Win 2016; Source: Barclays
Could a second term result in similar rotation? If the FOMC begins cutting rates, could we see growing interest in small caps, non-U.S. equities, and longer duration bond portfolios? In the near term, expect volatility and potential for softness in U.S. equity markets augmented by continued buying of U.S. Treasuries and IG credit. Longer term, with earnings expectations and results (thus far) remaining strong along with good momentum, the equity market looks fairly healthy. When the presidential election has been settled and political anxieties (hopefully) subside, expect capital on sidelines to flow into financial markets. The big question is: where? We are overdue for market rotation and the combination of a political pivot, slowing growth, rate cuts, and geopolitical conflict may shift markets in a different direction.
Meet Your Expert
Grant Johnsey
Grant is responsible for delivering capital market solutions to institutional clients across agency brokerage, transition management, security finance, and foreign exchange.

Northern Trust Securities, Inc.(NTSI), Member FINRA, SIPC and a subsidiary of Northern Trust Corporation. Products and services offered through NTSI are not FDIC insured, not guaranteed by any bank, and are subject to investment risk including loss of principal amount invested. Additional disclosures are included in the link, see http://www.northerntrust.com/ntsidisclosure
Business Continuity Notice- Northern Trust Securities, Inc.