- Who We Serve
- What We Do
- About Us
- Insights & Research
- Who We Serve
- What We Do
- About Us
- Insights & Research
How Might Preferred Stock Fit in a Portfolio?
Sensitivity of preferred stock return to equity-like default risk is most similar to high yield.
By David Moore, CFA, CAIA, Senior Vice President Portfolio Research
Peter Mladina, Executive Director of Portfolio Research, Wealth Management
With low interest rates expected for the foreseeable future, some investors are seeking higher yields from assets other than traditional fixed income. Our 2018 research article Don’t Undermine Diversification by Reaching for Yield warns investors to be careful when reaching for yield, as elevated credit risk can undermine the diversification benefits of high-grade bonds. This is why high-yield bonds are part of the risk-asset allocation. More recently, some wealth management investors have begun looking closer at niche securities like preferred stock, historically dominated by institutional investors.
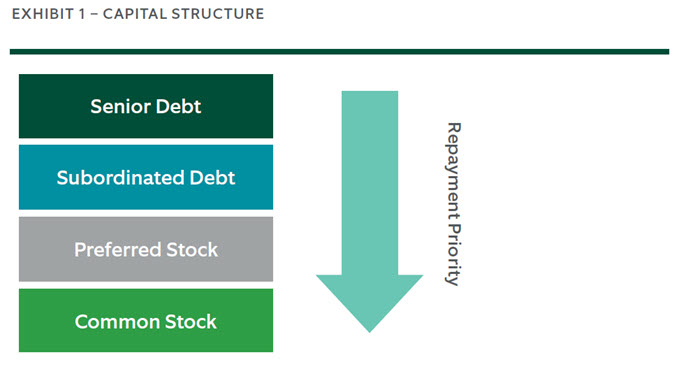
Within a firm’s capital structure, preferred stock is an intermediate position that is junior to bondholders but senior to common stockholders. Preferred stocks share many key characteristics with bonds. Like bonds, preferred stocks are issued with a fixed par value and pay a fixed or floating rate of income off the par value. If interest rates rise, the value of preferred shares falls. But unlike a bond’s coupon, a preferred stock’s dividend can be deferred or omitted by company management in periods of stress. Preferred stock also has a deep subordination of claims to company assets in the event of bankruptcy (Exhibit 1). These features expose investors to material credit risk. Credit agencies commonly rate preferred stock a few notches below an issuer’s senior debt.
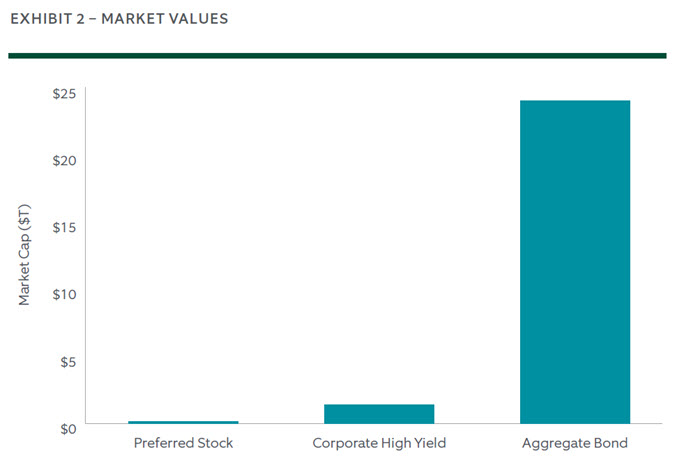
Meanwhile, investors expect to earn a higher dividend from preferred stock than either common stock or the bond’s coupon, particularly after tax. Corporations benefit from IRS rules on deducting dividends received and personal investors benefit from qualified dividend treatment of most (but not all) preferred stocks being taxed at the long-term capital gains rate. Despite bond-like attributes, preferred stock is not part of common fixed income benchmarks like the Bloomberg Barclays Aggregate Bond Index or Corporate High Yield Index and the market value of exchange-traded U.S. preferred stocks is relatively minimal (Exhibit 2).
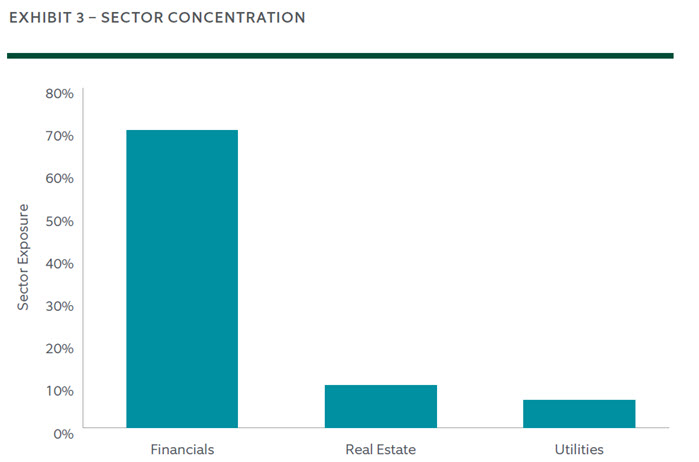
Given the payment optionality of preferred stock dividends, investors seek issuers with high-quality, stable business models and transparent cash flows. More recently, this has manifested in sector concentrations within regulated institutions like banks, REITs, and utilities (Exhibit 3).
Corporate balance sheets benefit from credit agency and regulator treatment of preferred stock. Since the Global Financial Crisis, in particular, the Federal Reserve has focused on leverage ratios in assessing capital adequacy and preferred stock is considered Tier 1 capital. Preferred stock also tends to be a cheaper source of capital than common stock. The return behaviors of preferred stock are critical to understanding how the asset might fit within a total portfolio. We compare the S&P Preferred Stock Index to the Aggregate Bond Index and Corporate High Yield Index since common inception of September 2003 through June 2020 (Exhibit 4).
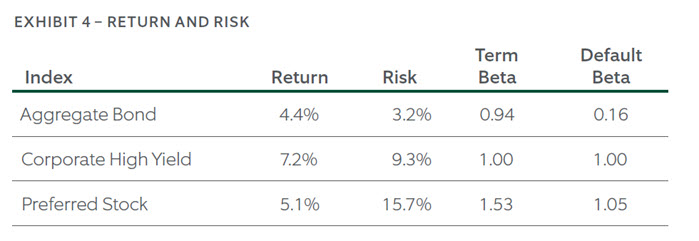
The Aggregate Bond Index returned 4.4% (annualized) with a standard deviation of 3.2%. In comparison, the Corporate High Yield Index had a meaningfully higher return of 7.2% with an elevated standard deviation of 9.3%. Preferred Stock had a modestly higher return of 5.1% with a much higher standard deviation of 15.7%.
Term and default factors are well documented sources of return and risk in bond markets. Term represents maturity-related interest rate risk. Default represents equity-like default or credit risk. The Aggregate Bond Index has a much smaller default beta than the Corporate High Yield Index, as the Aggregate’s return behaviors are largely driven by diversifying term risk. The difference in default betas largely explains the difference in standard deviations. In comparison, the Preferred Stock Index has an elevated term beta due to its lack of fixed maturity. More importantly, it has a high default beta similar to highyield bonds. Additionally, the majority of preferred stock risk is uncompensated, idiosyncratic risk. The high default beta and idiosyncratic risk together explain its high standard deviation. Preferred stock shows high sensitivity to equity-like default risk, which makes the return behaviors more like high-yield bonds. For investors with continued desire to own preferred stock in a diversified portfolio, best practice would be to fulfill it as part of the high-yield allocation within risk assets.

© 2025 Northern Trust Corporation. Head Office: 50 South La Salle Street, Chicago, Illinois 60603 U.S.A. Incorporated with limited liability in the U.S.
This document is a general communication being provided for informational and educational purposes only. The opinions and conclusions expressed herein are those of the authors and are not meant to be taken as investment advice or a recommendation for any specific investment product or strategy and does not take your financial situation, investment objective or risk tolerance into consideration. Performance examples are hypothetical and for illustration purposes only and actual results may be lower or higher than a portfolio that may be more or less diversified and/or managed in a different manner. In performing its services, Northern Trust will take into account other relevant facts and circumstances such that positions and transactions for any particular client account may differ with the investments described herein. Northern Trust provides fiduciary and investment management services to various types of accounts, including but not limited to, separately managed accounts, registered and unregistered funds. The investment advice given to one client account may differ from the investment advice given to another client account. Northern Trust and its affiliates may have positions in, and may effect transactions in, the markets, contracts and related investments described herein, which positions and transactions may be in addition to, or different from, those taken in connection with the investments described herein. All information discussed herein is current only as of the date of publication and is subject to change at any time without notice. This material has been obtained from sources believed to be reliable, but its accuracy, completeness and interpretation cannot be guaranteed. Readers, including professionals, should under no circumstances rely upon this information as a substitute for their own research or for obtaining specific legal, accounting or tax advice from their own counsel.
All investments involve risk and can lose value. The market value and income from investments may fluctuate in amounts greater than the market. Forecasts may not be realized due to a multitude of factors, including but not limited to, changes in economic conditions, corporate profitability, geopolitical conditions or inflation.
LEGAL, INVESTMENT AND TAX NOTICE. This information is not intended to be and should not be treated as legal, investment, accounting or tax advice.
PAST PERFORMANCE IS NO GUARANTEE OF FUTURE RESULTS. Periods greater than one year are annualized except where indicated. Returns of the indexes also do not typically reflect the deduction of investment management fees, trading costs or other expenses. It is not possible to invest directly in an index. Indexes are the property of their respective owners, all rights reserved.