- Who We Serve
- What We Do
- About Us
- Insights & Research
- Who We Serve
- What We Do
- About Us
- Insights & Research
Tariff Tantrum
As policy uncertainty grows, we consider how tariffs and other government actions might impact inflation, interest rates, and market sentiment.
KEY POINTS
What it is
We explore how recent volatility ties into broader concerns around trade tensions, slowing growth, and evolving central bank responses.
Why it matters
As policy signals remain mixed, near-term market performance may continue to be volatile, prompting investors to tread carefully.
Where it's going
Uncertainty around growth, inflation, and policy responses may continue to influence market behavior, but resilience across certain areas could support broader balance.
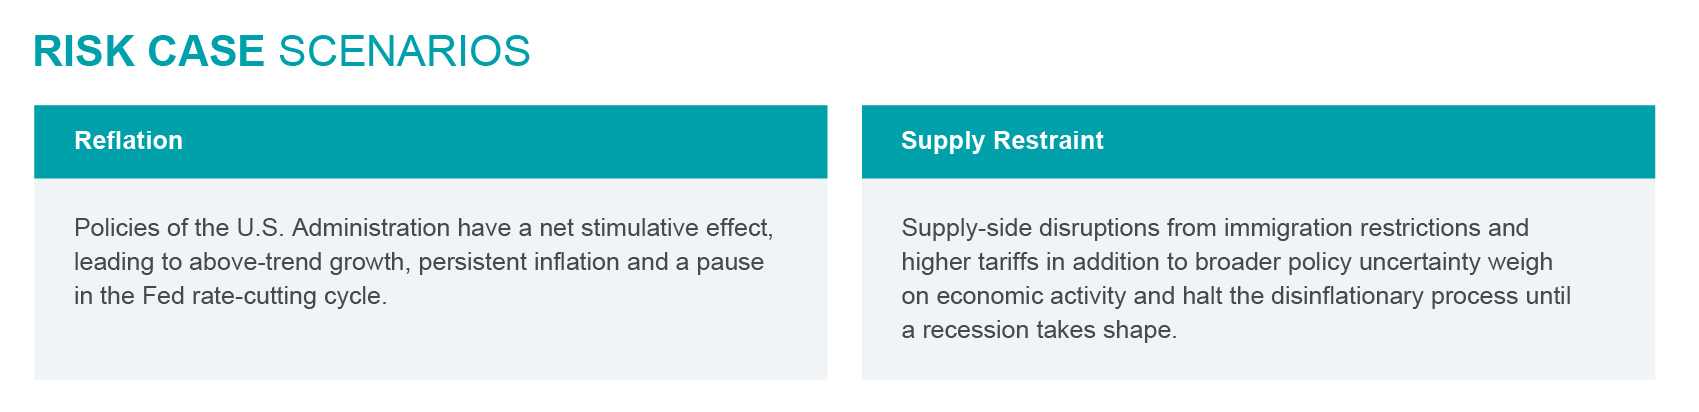
Holding the U.S. base case, but uncertainty is higher: Tariff uncertainty is at all-time highs and we see higher potential for a negative outcome. Regarding broader policy uncertainty, higher tariffs could weigh on low-income consumers, falling asset prices pose risk to higher-income consumers, and labor market drag from federal layoffs is starting to surface. Uncertainty from tariffs and other government policies could persist for several months as processes unfold. Policy risks have coincided with downward revisions to growth expectations and upward revisions to inflation forecasts. Consensus expectations for full-year 2025 U.S. GDP growth were lowered to 2.0% from 2.2% last month. Expectations for core Personal Consumption Expenditures (PCE) over the next couple of quarters modestly increased. While cooling, the U.S. economy is expected to continue to grow, and recession probabilities are low.
Our base case expectation remains for U.S. economic growth to slow to around trend, inflation to ease with the potential for near-term boosts from tariffs, and the Fed to proceed with a gradual pace of rate cuts. Uncertain tariff policies continue to pose both upside and downside risk, including economic disruption from policy shocks.
A brighter outlook for Europe: Germany announced massive fiscal reform that would allow defense spending to essentially circumvent the debt brake and also deliver a €500 billion infrastructure fund over 10 years. Approval is still pending but looks likely. The fiscal boost should provide multi-year support to the European economy and is occurring at a time when central bank rate cuts are starting to lift activity from low levels and Russia-Ukraine tensions are easing. We see higher odds that the Euro Area can achieve around 1% real growth. The improved growth outlook has started to feed through to better earnings revisions for non-U.S. equities, particularly relative to weaker U.S. estimates. Tariff risk is still a factor, but we believe the fundamental changes are sufficient to remove the underweight to developed ex-U.S. equities.
Maintaining the U.S. equity allocation: Government policies have weighed on the U.S. equity market, with the S&P 500 Index nearing a 10% correction in a span of less than a month. Given the recent drawdown, weaker sentiment, and no major change to the baseline economic expectation of a soft landing, we do not think it is an opportune time to reduce U.S. equity exposure. Instead, we preferred to fund the increased international equity allocation with high yield. High yield has posted a positive total return year-to-date, which is a notable feat given the magnitude of the U.S. equity market drawdown. We view the trade as an opportunity to take profit in one area in order to reduce underweight exposure to an asset class with the potential for tactical outperformance. Overall, the committee still likes high yield. The tactical portfolio is overweight equities and real assets, and underweight fixed income. We recommend having some inflation protection and staying diversified in what has been an uncertain environment due to government policy.
— Peter Wilke, CFA – Head of Tactical Asset Allocation, Global Asset Allocation
POLICY UNCERTAINTY IS VERY HIGH
A great deal of uncertainty centered on tariff impacts continues to keep equity markets on edge.

Source: Northern Trust Asset Management, Macrobond, Matteo lacoviello, Economic Policy Uncertainty. One-month smoothed measures of daily data. Data from 12/31/2014 through 3/17/2025. Historical trends are not predictive of future results.
Interest Rates
It has been quite the start to the year in interest rate markets, with ten-year U.S. Treasury yields trading in a 65 basis point (bps) range year-to-date, between ~4.80% and ~4.15%. The recent move lower has returned yields to levels not seen since last Fall, prior to the U.S. Presidential election. Volatility in the market for U.S. Treasuries has also increased, as measured by the MOVE1 index, increasing to ~115, a level also not seen since last Fall.
So why are we seeing such large moves in interest rate markets? The moves make more sense in a backdrop of significant uncertainty around the near-term path for the macroeconomy. Rapid developments around tariffs and other government policies can send a wave of cross currents through the economy, making it exceedingly difficult to forecast. This becomes even more challenging in an economy already expected to cool, with inflation slowing towards the Fed’s target of 2%. Fed officials have recently commented that, while they continue to monitor the incoming data closely, they aren’t in a hurry to adjust policy in response to a few surveys. We tend to agree and look forward with more confidence that 2026 is likely to bring lower rates, despite elevated uncertainty this year.
— Dan LaRocco, Head of U.S. Liquidity, Global Fixed Income
RATES ON THE MOVE
Volatility in the U.S. Treasury bond market has increased.
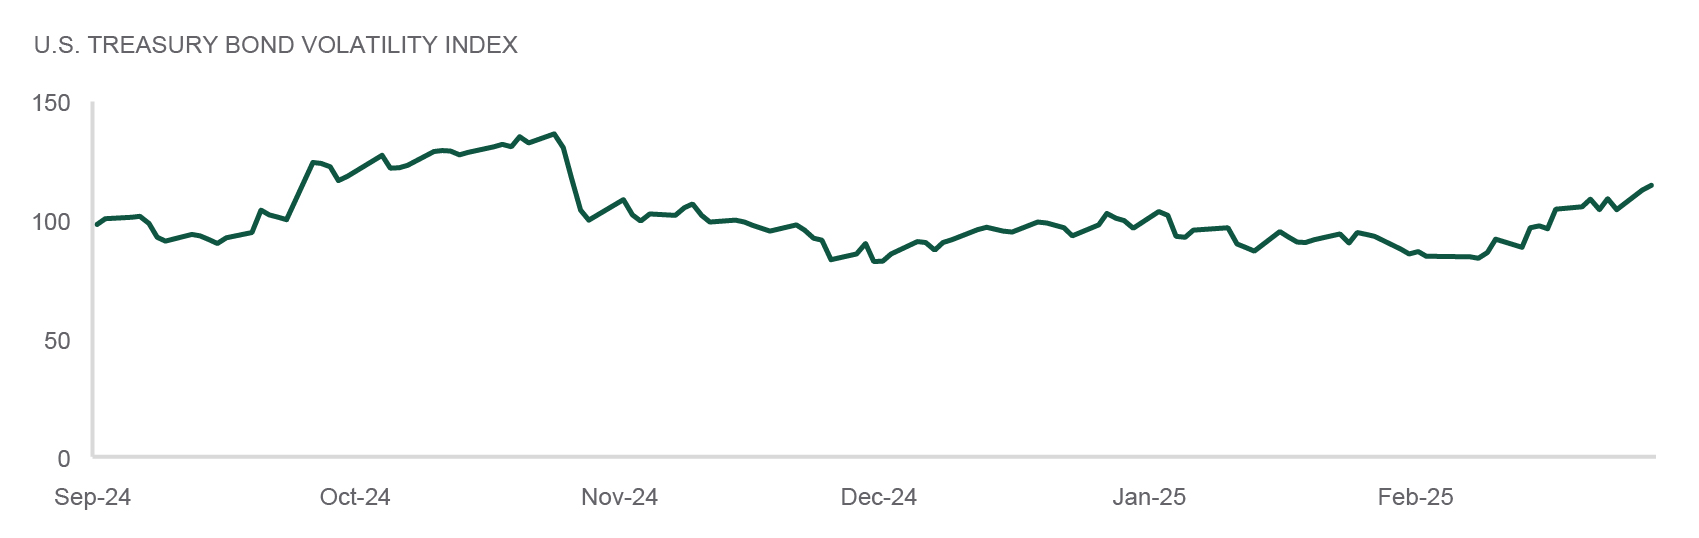
Source: Northern Trust Asset Management, Bloomberg. Data from 9/12/2024 through 3/11/2025. MOVE1 = Merrill Lynch Option Volatility Estimate. It is a measure of market expectations for future volatility in the U.S. Treasury bond market. Historical trends are not predictive of future results.
- Volatility has increased in the U.S. Treasury market.
- This is a reasonable response to significant uncertainty around the near-term path for the economy.
- 2026 may bring more certainty, presenting potential opportunities in the 2-3 year sector of the U.S. Treasury curve.
Credit Markets
February marked an increase in equity market uncertainty as tariff threats, geopolitical unrest and weaker economic data all contributed to a reset of risk appetite in stocks. Despite rising equity market volatility, the high yield (HY) bond market held firm with declining Treasury yields helping to offset modest spread widening. High-yield funds have continued to see robust inflows. Assets under management (AUM) for dedicated HY retail bond funds rose to a 3-year high of $360.7bn and are only $13.4bn below the record high. Meanwhile, HY ETFs currently have a record $90.1bn of AUM, which accounts for a record 25.0% of the traditional retail HY mutual fund base.
Based on the increase in AUM of these passive products, there could be an increase in forced buying and selling in smaller bonds and issuers than in prior years due to the new breadth of the product. This cohort of the market can provide an abundance of opportunity for active investors looking to capture mispricing and inefficiencies in the market. Fundamental credit work and security selection is paramount to generating excess returns in this segment of the market especially alongside the complicated economic backdrop.
— Eric Williams, Head of Capital Structure, Global Fixed Income
HIGH YIELD ACTIVE VS. PASSIVE FLOWS
High yield funds have continued to see robust inflows.
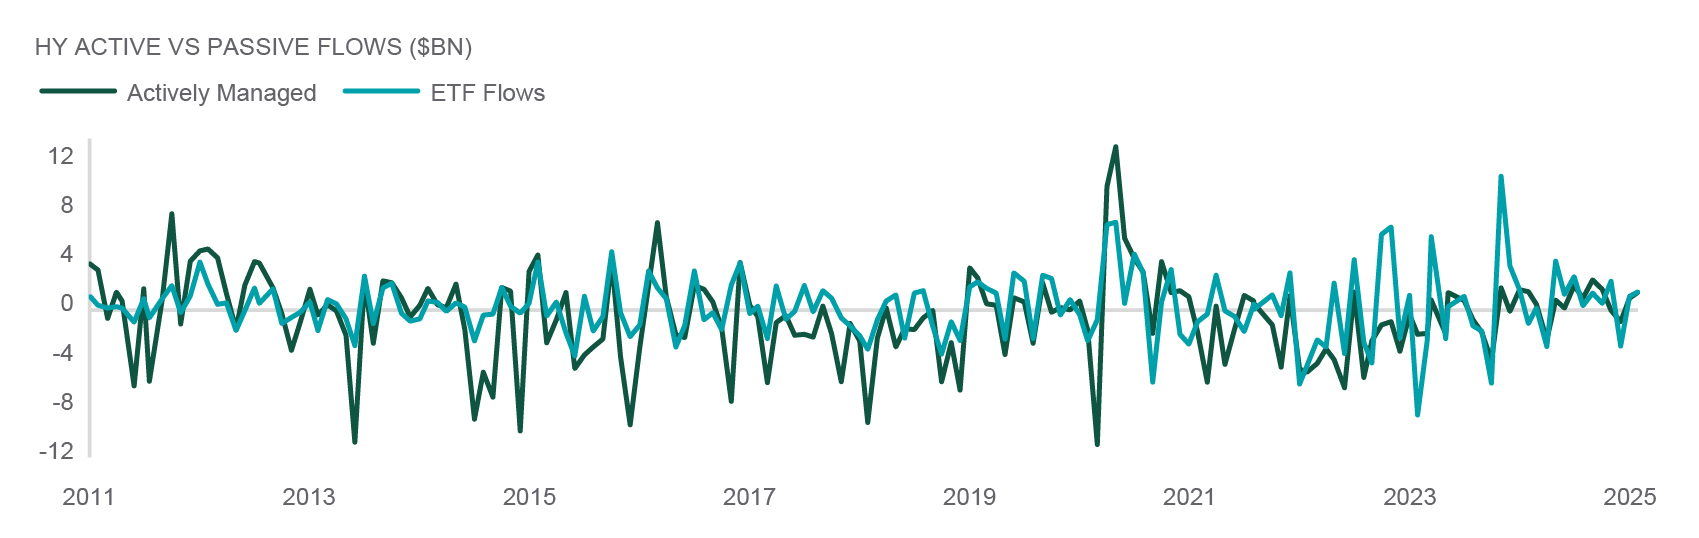
Source: Northern Trust Asset Management, Lipper FMI, JPMorgan. HY = High Yield. Data from 12/31/2010 through 2/28/2025. Historical trends are not predictive of future results.
- High yield ETFs have increased meaningfully in size over the last 12 months.
- Based on the increase in AUM of high yield passive products, there could be an increase in forced buying and selling in smaller bonds and issuers than in prior years.
- Market technicals in ETFs can provide an abundance of opportunity for active investors looking to capture mispricing and inefficiencies in the market.
Equities
After hitting an all-time high on February 19, U.S. large caps sold off 9.1% over the next 15 trading sessions. Increased uncertainty has led to a striking reversal in market leadership as investors sought shelter in low volatility and high quality stocks. These stocks have outperformed the broader benchmark by 5.5% since the sell-off began and are essentially flat year-to-date. Outside the U.S., investors are finally reaping the benefits of diversification with developed ex-U.S. markets up 0.2% during the sell-off period and up 7.8% year-to-date.
The U.S. earnings outlook remains constructive despite downward analyst revisions in February. However, given the recent drawdown, weaker sentiment, and no major change to the baseline economic expectation, we do not think it is an opportune time to reduce U.S. equity exposure. For developed ex-U.S. equities, Germany’s proposal for massive defense and infrastructure spending is expected to boost growth for several years. Challenges remain, including the ongoing tariff turmoil and other longstanding structural challenges to growth. Overall, we believe the fundamental changes are sufficient to remove the underweight to developed ex-U.S. equities.
— Jordan Dekhayser, Head of Equity Client Portfolio Management
SHELTER FROM THE STORM
Defense and Diversification paying off in 2025.

Source: Northern Trust Asset Management, MSCI. U.S. is MSCI U.S., Developed ex-U.S. is MSCI World ex-USA and Quality Low Volatility is the Northern Trust Quality Low Volatility Index. Data from 12/31/2024 through 3/12/2025. Past performance is not indicative or a guarantee of future results. Index performance returns do not reflect any management fees, transaction costs or expenses. It is not possible to invest directly in any index.
- High quality and low volatility stocks provided significant protection for investors during the recent market route.
- Developed ex-U.S. stocks provided much needed diversification as proposed infrastructure and defense spending in Europe boosted markets.
- With a long-awaited catalyst for Europe emerging, we closed our underweight to developed ex-U.S. stocks.
Real Assets
Over the last 24 months, Commercial Real Estate (CRE) investors have been contemplating the CRE “wall of debt maturities”. Lenders and borrowers have been modifying their agreements amidst a historic increase in interest rates and a subdued transaction market. Commercial mortgage delinquency rates have been ticking up, but are still far below Global Financial Crisis / COVID pandemic levels.
Today, we seem to be entering an environment where broader market acceptance of “higher for longer” interest rates may be altering behaviors. Market participants are becoming less hopeful that interest rates and borrowing costs will come down through FOMC1 policies and actions.
Investments made during times of dislocation typically have greater potential to outperform those made in more stable environments. Listed REITs2 have demonstrated the ability to access debt capital through the unsecured debt markets as well as equity through common share offerings. Companies are increasingly tapping these sources to fund future accretive external growth. With the availability of relatively inexpensive capital at scale, Global Real Estate is well-positioned to go on offense.
— Jim Hardman, Head of Real Assets, Multi-Manager Solutions
DISLOCATION FORTHCOMING?
Historical commercial mortgage delinquency rates.

Source: Northern Trust Asset Management, Mortgage Banker Association. Commercial and Multifamily mortgage delinquency rates. Annual data from 12/31/2004 through 9/30/2024. Historical trends are not predictive of future results.
- U.S. economic conditions are supportive of healthy real estate markets.
- We confirm our slight overweight to real estate on stable fundamentals, discounted valuations, and private market dry powder.

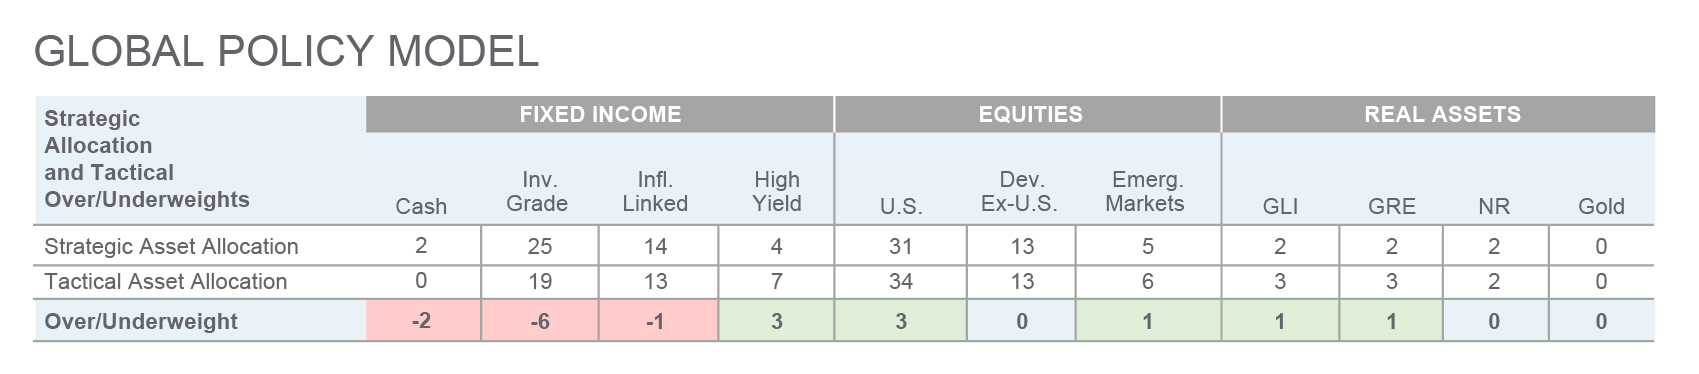
Source: Northern Trust Capital Market Assumptions Working Group, Investment Policy Committee. Strategic allocation is based on capital market return, risk and correlation assumptions developed annually; most recent model released 1/15/2025.The model cannot account for the impact that economic, market and other factors may have on the implementation and ongoing management of an actual investment strategy. Asset allocation does not guarantee a profit or protection against a loss in declining markets. GLI = Global Listed Infrastructure, GRE = Global Real Estate, NR = Natural Resources. Unless otherwise noted, the statements expressed herein are solely opinions of Northern Trust. Northern Trust does not make any representation, assurance, or other promise as to the accuracy, impact, or potential occurrence of any events or outcomes expressed in such opinions.
Unless noted otherwise, data on this page is sourced from Bloomberg as of March 2025.
CMBS: Commercial Mortgage-Backed Securities
1 FOMC: Federal Open Market Committee
2 REIT: Real Estate Investment Trust
IMPORTANT INFORMATION
Northern Trust Asset Management (NTAM) is composed of Northern Trust Investments, Inc., Northern Trust Global Investments Limited, Northern Trust Fund Managers (Ireland) Limited, Northern Trust Global Investments Japan, K.K., NT Global Advisors, Inc., 50 South Capital Advisors, LLC, Northern Trust Asset Management Australia Pty Ltd, and investment personnel of The Northern Trust Company of Hong Kong Limited and The Northern Trust Company.
Issued in the United Kingdom by Northern Trust Global Investments Limited, issued in the European Economic Association (“EEA”) by Northern Trust Fund Managers (Ireland) Limited, issued in Australia by Northern Trust Asset Management (Australia) Limited (ACN 648 476 019) which holds an Australian Financial Services Licence (License Number: 529895) and is regulated by the Australian Securities and Investments Commission (ASIC), and issued in Hong Kong by The Northern Trust Company of Hong Kong Limited which is regulated by the Hong Kong Securities and Futures Commission.
For Asia-Pacific (APAC) and Europe, Middle East and Africa (EMEA) markets, this information is directed to institutional, professional and wholesale clients or investors only and should not be relied upon by retail clients or investors. This information may not be edited, altered, revised, paraphrased, or otherwise modified without the prior written permission of NTAM. The information is not intended for distribution or use by any person in any jurisdiction where such distribution would be contrary to local law or regulation. NTAM may have positions in and may effect transactions in the markets, contracts and related investments different than described in this information. This information is obtained from sources believed to be reliable, its accuracy and completeness are not guaranteed, and is subject to change. Information does not constitute a recommendation of any investment strategy, is not intended as investment advice and does not take into account all the circumstances of each investor.
This report is provided for informational purposes only and is not intended to be, and should not be construed as, an offer, solicitation or recommendation with respect to any transaction and should not be treated as legal advice, investment advice or tax advice. Recipients should not rely upon this information as a substitute for obtaining specific legal or tax advice from their own professional legal or tax advisors. References to specific securities and their issuers are for illustrative purposes only and are not intended and should not be interpreted as recommendations to purchase or sell such securities. Indices and trademarks are the property of their respective owners. Information is subject to change based on market or other conditions.
All securities investing and trading activities risk the loss of capital. Each portfolio is subject to substantial risks including market risks, strategy risks, advisor risk, and risks with respect to its investment in other structures. There can be no assurance that any portfolio investment objectives will be achieved, or that any investment will achieve profits or avoid incurring substantial losses. No investment strategy or risk management technique can guarantee returns or eliminate risk in any market environment. Risk controls and models do not promise any level of performance or guarantee against loss of principal. Any discussion of risk management is intended to describe NTAM’s efforts to monitor and manage risk but does not imply low risk.
Past performance is not a guarantee of future results. Performance returns and the principal value of an investment will fluctuate. Performance returns contained herein are subject to revision by NTAM. Comparative indices shown are provided as an indication of the performance of a particular segment of the capital markets and/or alternative strategies in general. Index performance returns do not reflect any management fees, transaction costs or expenses. It is not possible to invest directly in any index. Net performance returns are reduced by investment management fees and other expenses relating to the management of the account. Gross performance returns contained herein include reinvestment of dividends and other earnings, transaction costs, and all fees and expenses other than investment management fees, unless indicated otherwise. For U.S. NTI prospects or clients, please refer to Part 2a of the Form ADV or consult an NTI representative for additional information on fees.
Hypothetical portfolio information provided does not represent results of an actual investment portfolio but reflects representative historical performance of the strategies, funds or accounts listed herein, which were selected with the benefit of hindsight. Hypothetical performance results do not reflect actual trading. No representation is being made that any portfolio will achieve a performance record similar to that shown. A hypothetical investment does not necessarily take into account the fees, risks, economic or market factors/conditions an investor might experience in actual trading. Hypothetical results may have under- or over-compensation for the impact, if any, of certain market factors such as lack of liquidity, economic or market factors/conditions. The investment returns of other clients may differ materially from the portfolio portrayed. There are numerous other factors related to the markets in general or to the implementation of any specific program that cannot be fully accounted for in the preparation of hypothetical performance results. The information is confidential and may not be duplicated in any form or disseminated without the prior consent of (NTI) or its affiliates.
Forward-looking statements and assumptions are NTAM’s current estimates or expectations of future events or future results based upon proprietary research and should not be construed as an estimate or promise of results that a portfolio may achieve. Actual results could differ materially from the results indicated by this information.
Not FDIC insured | May lose value | No bank guarantee