- Who We Serve
- What We Do
- About Us
- Insights & Research
- Who We Serve
- What We Do
- About Us
- Insights & Research
Two Policy Risks in the Spotlight
Looming U.S. and global policy shifts may potentially rattle markets, but a tactical and flexible approach could help investors navigate risks and opportunities regardless of how events play out.
KEY POINTS
What it is
We’re focused on potential domestic policy gridlock and global trade renegotiations and how they might affect the markets with potential ups and downs as 2025 unfolds.
Why it matters
These policy risks merit close attention because they could potentially reshape economic conditions and influence market stability in unpredictable ways.
Where it's going
Maintaining a flexible approach as these policies evolve can help investors navigate upcoming risks or opportunities.
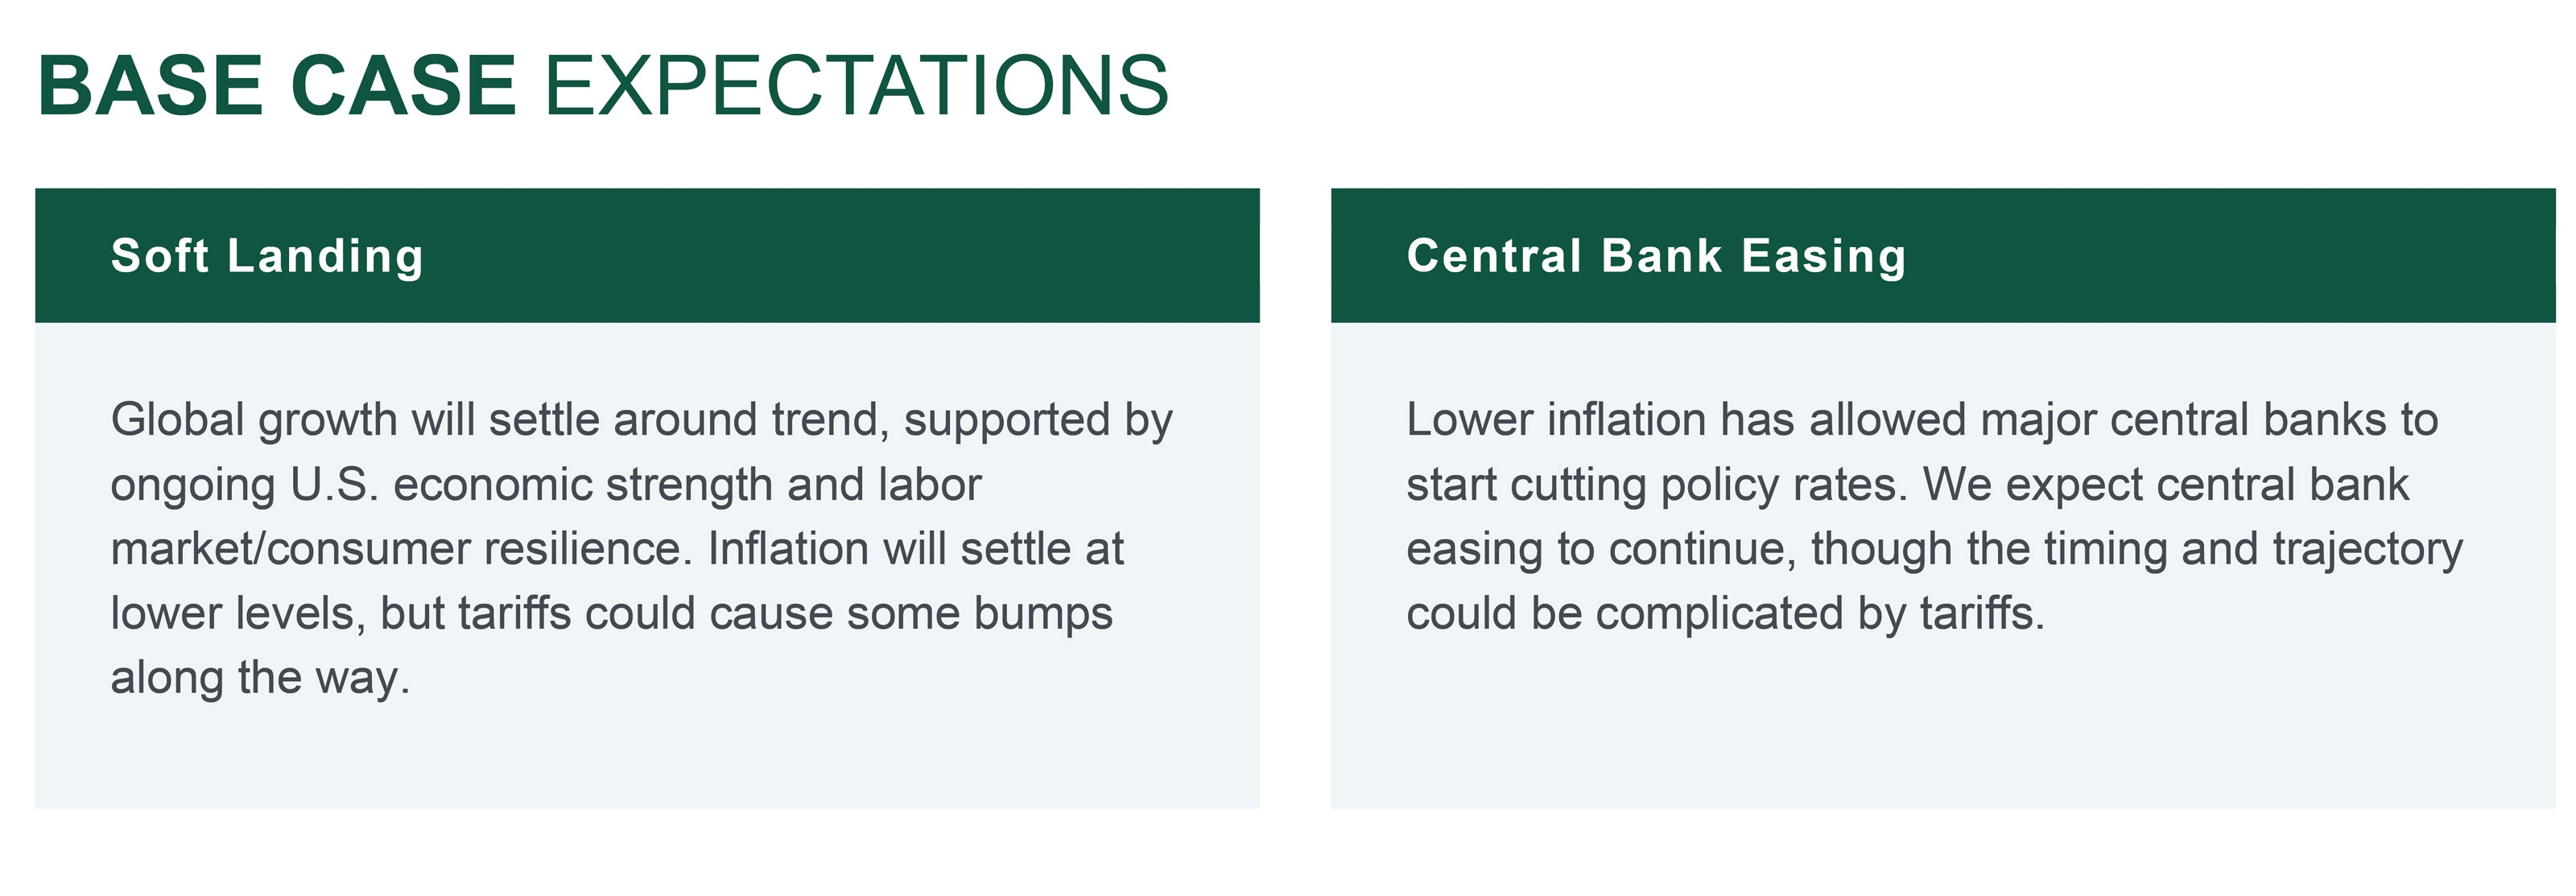
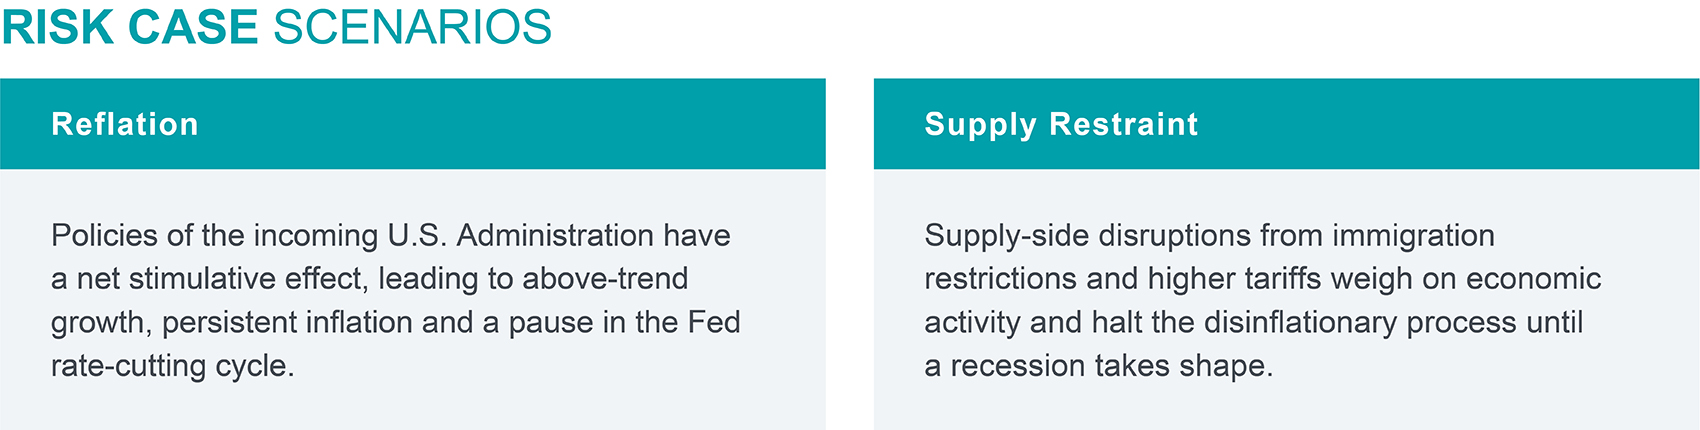
There are two significant policy risks looming in the weeks ahead: U.S. domestic policy risk and global policy risk. Overall, financial markets believe that these two policy risks could limit economic growth and cause inflation. However, we continue to believe that the optimal way to navigate these risks is through a tactical and flexible approach. As more details of policy changes emerge, we could witness substantial market moves in either direction. For example, meaningful progress in trade negotiations with Canada and Mexico could provide quick relief to markets and lead to a risk-on environment. On the contrary, a prolonged period of intense negotiations with all U.S. trading partners could cause investors to lose patience and exert downward pressure on risk assets.
Domestic Policy Risk: The current federal government funding expires on March 14th. To avoid a shutdown, Congress needs to pass new spending legislation or extend the current funding. There are significant disagreements between Democrats and Republicans over the Trump Administration’s actions, such as dismantling government programs and agencies, and freezing government grants. Some Democrats are willing to use the threat of a shutdown as leverage to force changes in the Trump Administration’s decisions. Given the slim majority in both the Senate and the House, it will be very difficult to pass funding bills without Democratic support. If a potential shutdown were to continue into the month of April, this could create further downside risks to growth.
Global Policy Risk: As expected, the Trump Administration started the process of renegotiating trade agreements with its major trading partners. While this did not come as a surprise, it happens at a time when the geopolitical landscape is in flux, with high-stakes diplomacy and potential shifts in trade policies creating uncertainty. The trade discussions between the EU and the U.S. are likely to intensify in the coming weeks. We believe that there are positive paths for both sides to agree on a deal which would involve greater EU imports of liquefied natural gas (LNG) and increased military spending. However, discussions about non-tariff trade barriers are unlikely to be resolved quickly. In summary, markets are priced for an increase in U.S. tariff rates last seen in the 1960s. While some of the benefits may show up in increased domestic capacity to produce certain goods (e.g. cars, steel, aluminum), this could be a slow process and could be undermined by pressure on consumer spending as prices for many consumer goods are likely to reflect higher tariff costs much sooner.
In conclusion, the financial markets are facing a period of heightened uncertainty driven by policy risks, slower growth, and inflation concerns. The combination of domestic political gridlock and ongoing global trade tensions requires investors to be disciplined about portfolio strategy and maintain flexibility to adjust their risk stance as new information emerges.
— Peter Wilke, CFA – Head of Tactical Asset Allocation, Global Asset Allocation
TARIFFS EXPECTED TO INCREASE FROM THE CURRENT LEVEL OF AROUND 2.5%
The baseline market expectation seems to be for the average tariff rate to increase towards ~5%.
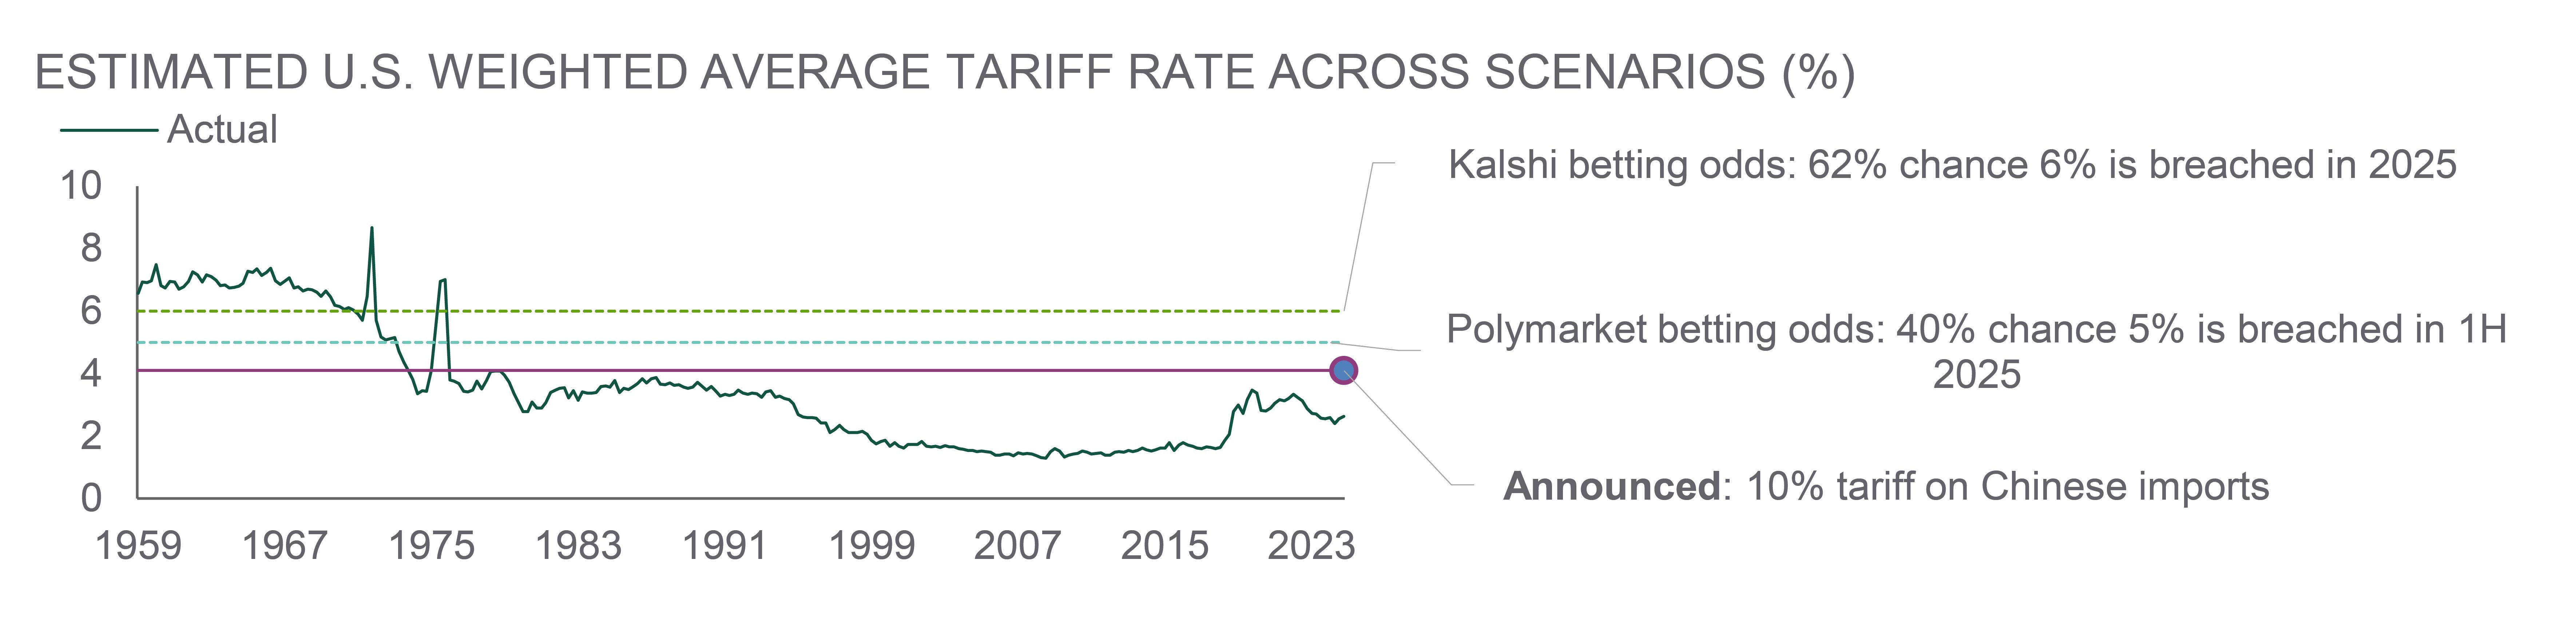
Source: Northern Trust Asset Management, Macrobond, U.S. Bureau of Economic Analysis, Kalshi and Polymarket betting odds as of 2/18/2025. 1H = First half. Actual tariff rate from 1959 through 2024. Polymarket and Kalshi betting odds defined on page 5. Historical trends are not predictive of future results.
Polymarket betting odds: Polymarket users can create prediction markets around any real-world event that they choose. To do so, they propose an event, such as “Will [Event] occur by [Date]?” The market creator defines the possible outcomes (e.g., Yes or No) and adds details to clarify conditions for resolution. Other users can then participate by placing bets on the outcome they believe is most likely. As bets are placed, Polymarket automatically adjusts odds based on the market’s activity. If more users bet on one outcome, the odds will reflect a higher likelihood of that event happening.
Kalshi betting odds: At the core of Kalshi's pricing system is the concept of market-assigned probability. The platform continuously assesses the collective sentiment of its users regarding the likelihood of an event resulting in a "Yes" or "No" outcome. This probability is expressed as a percentage, ranging from 0% (certain to not happen) to 100% (certain to happen). The contract price for a particular event is directly tied to this probability. As the perceived likelihood of a "Yes" outcome increases, the contract price for "Yes" will rise, while the contract price for "No" will correspondingly decrease. Conversely, if the market believes a "No" outcome is more probable, the contract price for "No" will increase, and the contract price for "Yes" will fall.
Interest Rates
The FOMC voted unanimously last month to leave the Federal Funds Target Range unchanged at 4.25% to 4.5%, as widely anticipated by markets. Treasury yields rose initially upon the release of the Policy Statement but mostly reversed course by the end of Chair Powell’s press conference. We took the main message from the meeting to be that, as signaled at their December meeting, the Committee views the economy and monetary policy as in a good place, which positioned them to leave policy unchanged while they assess subsequent economic data points on both sides of their dual mandate.
Overall, the Chair’s press conference conveyed a message that the Committee, “do[es] not need to be in a hurry” to adjust its policy stance further. This view is predicated on the risks to achieving their dual mandate as being, “roughly in balance”. The Chair offered his view that they’ll “need to see further progress” on inflation in order to ease policy further. Markets exhibited a much more muted reaction than after the December 2024 meeting. The implied magnitude of further rate cuts over the rest of 2025 edged lower to 47 basis points (bps), which is broadly consistent with our forecast of two-to-three more 25-bp cuts this year.
— Dan LaRocco, Head of U.S. Liquidity, Global Fixed Income
NO NEED TO BE IN A HURRY
The FOMC committee views the risks to achieving their dual mandate as being “roughly in balance”.
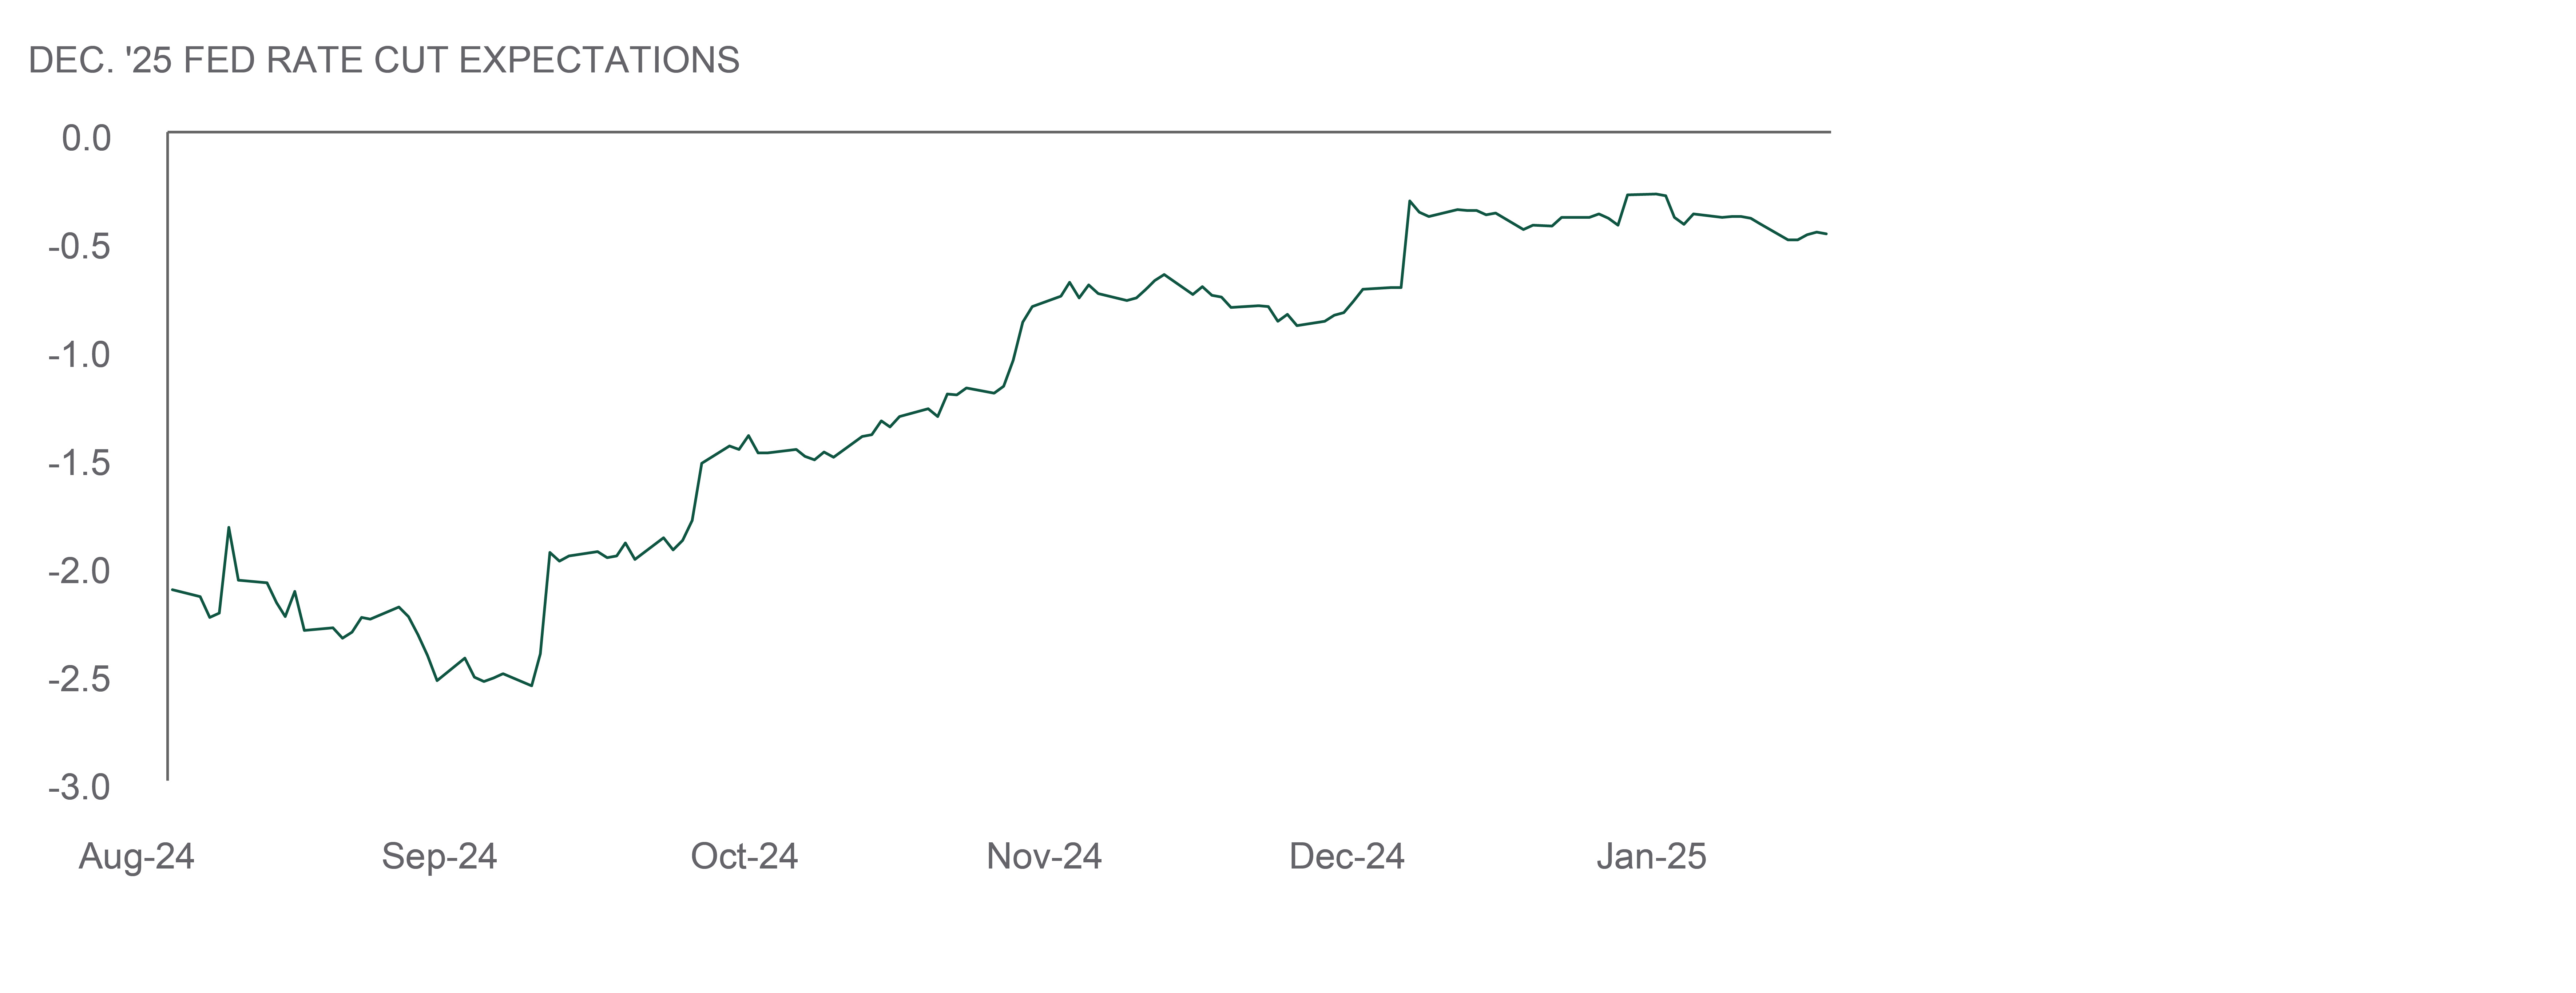
Source: Northern Trust Asset Management, Bloomberg. Data from 7/31/2024 through 1/31/2025. Historical trends are not predictive of future results
- While the outcome of the January FOMC meeting was widely anticipated, the Chair’s comments were consistent with our own view that the Committee is attentive to risks on both sides of its mandate.
- The Committee is not in a hurry to adjust policy further.
- Given the current economic data, and our expectations for growth to slow but not stall, we continue to view the two-to-three-year sector of the curve as attractive compared to our estimates of fair value.
Credit Markets
Credit markets continued to perform well driven by a mix of price gains, spread tightening and attractive coupon income. The technical backdrop for credit remains notably strong. Although the leveraged loan market continues to price record amounts of supply from repricings and refinancings, net supply across bonds and loans remains relatively muted. High yield (HY) saw strong outperformance, benefiting from rates and light supply for the month of January. As a result, the amount of high yield bonds trading at distressed levels has decreased for the sixth time in the last eight months to a 33-month low.
The distressed ratio is often looked upon as a forward looking indicator for defaults because bonds begin trading to recovery value as the market is forward looking in nature. The divergence between the distressed ratio and default rate could be an indication of bottoming in the high yield market. Cable and Satellite bonds account for 26% of bonds trading 1000bp+, which is followed by Healthcare (20%) and Broadcasting (12%). With the elevated level of uncertainty and distress in this cohort of the market, active management will be paramount to success in the upcoming year in some of these more troubled sectors.
— Eric Williams, Head of Capital Structure, Global Fixed Income
HIGH YIELD DISTRESSED RATIO
The divergence between the distressed ratio and default rate could be an indication of bottoming in the HY market.
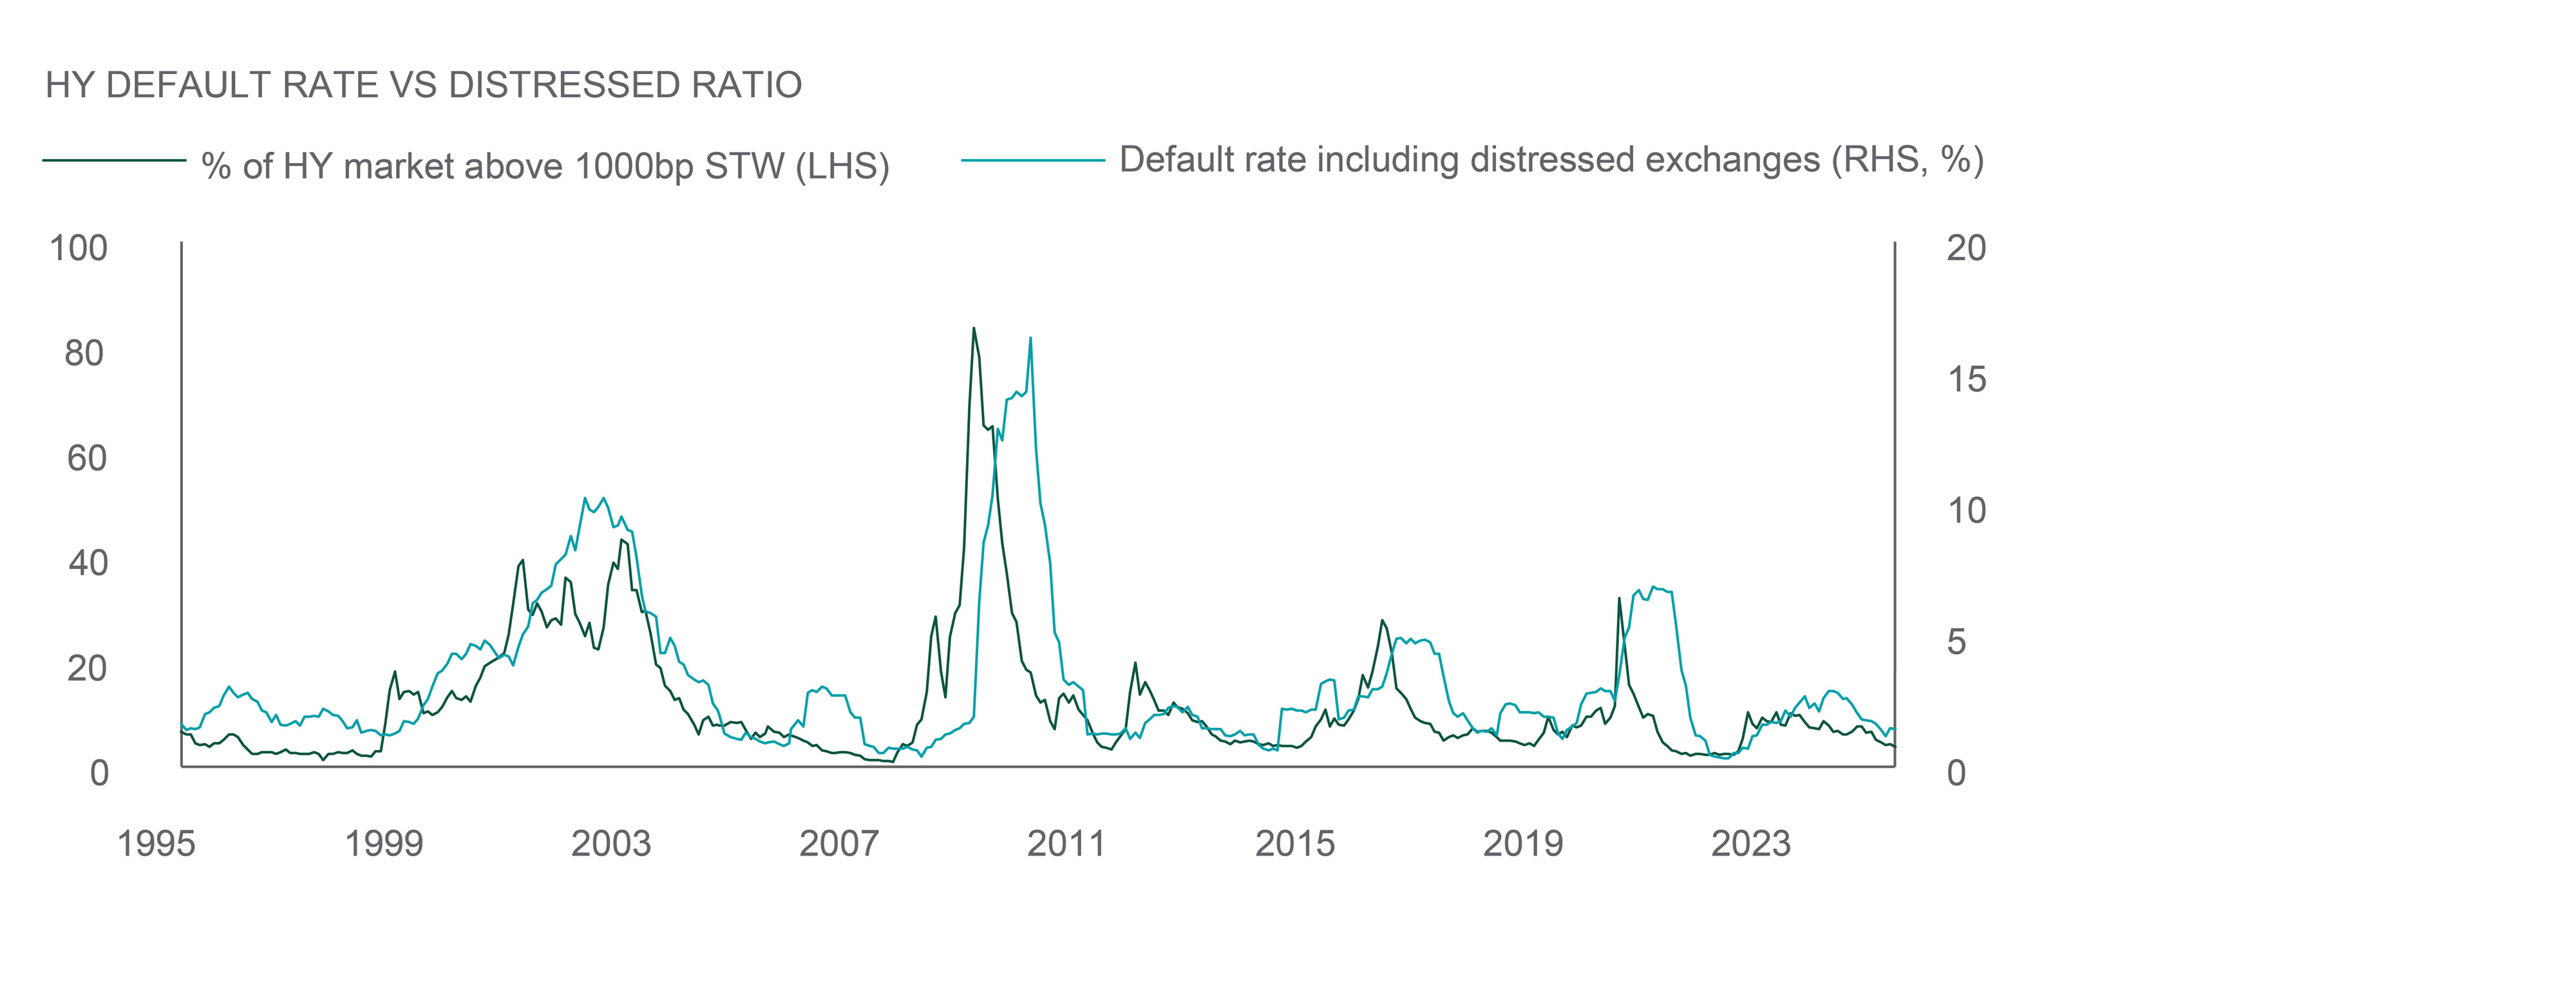
Sources: Northern Trust Asset Management, J.P. Morgan. Data from 12/31/1994 through 1/31/2025. Distressed levels are defined as bonds trading greater than 1000 basis points (bps) of spread. STW = Spread-to-worst. Historical trends are not predictive of future results.
- Credit markets continued to perform well driven by a mix of price gains, spread tightening and attractive coupon income.
- The amount of high yield bonds trading at distressed levels has decreased for the sixth time in the last eight months to a 33-month low.
- Cable and Satellite bonds account for 26% of bonds trading 1000bp+, which is followed by Healthcare (20%) and Broadcasting (12%).
Equities
The so-called January effect was in full force as markets around the globe rallied following a December swoon. U.S. large caps finished the month up 3.0% on decidedly better breadth than the depressed levels seen during most of 2023 and 2024. Despite market rattling events, equities remained resilient with U.S. large caps within 0.7% of all-time highs as of February 10. Outside the U.S., marking a turn, developed international markets led the way in January, up 5.0%. The dollar remains strong, but pulled back modestly in January against most currencies other than the pound. This provided a tailwind for U.S. based investors, which was not the case amid currency headwinds in 2024. Emerging Markets were also positive, up 1.8% in January with leadership out of Latin America.
U.S. economic data remains solid overall. Fourth quarter earnings have come in much better than expected, and the outlook for ’25 and ’26 continue to support elevated valuations in the U.S. and our overweight to U.S. equities. For developed ex-U.S. equities, despite the market bounce in January, the subdued economic growth outlook and exposure to potential tariffs continue to weigh on our outlook.
— Jordan Dekhayser, Head of Equity Client Portfolio Management
BETTER BREADTH FOR A HEALTHIER RALLY
Following historically low breadth in ’23 and ’24, January saw broader market participation.

Source: Northern Trust Asset Management, S&P Dow-Jones, FactSet. Total return data from 12/31/1990 through 1/31/2025. 2025 (teal bar) only counts the month of January. All other years are annual. Past performance is not indicative or a guarantee of future results. It is not possible to invest directly in any index.
- Markets shot higher to start the year as better than expected earnings provided comfort during multiple market shocks.
- Breadth improved after two historically low years of a small group of stocks leading markets higher.
- We maintain overweights to the U.S. and emerging markets. We are underweight developed ex-U.S. equities.
Real Assets
Despite market uncertainty, the U.S. economy is primed for growth in 2025, supported by consumer resilience, productivity gains, and easing financial conditions. Consumer balance sheets remain in good shape and this should result in growth in business investment, leading to stable, if not robust, real estate demand.
Conditions for industrial real estate remain stable and are supportive of additional rent growth. For stabilized assets, there may be upside risks as current market rents are higher than in-place rents, representing a mark-to-market opportunity.
Industrial real estate is expected to continue to benefit from economic expansion and e-commerce growth in 2025. Leasing activity is expected to return to pre-pandemic levels. Vacancy should remain higher in newer vintages as tenants continue their flight to quality. Some submarkets are digesting new supply but permitting is reduced and markets are expected to tighten further in the second half of 2025 and into 2026.
— Jim Hardman, Head of Real Assets, Multi-Manager Solutions
INDUSTRIAL INTEREST
The industrial real estate market is expected to tighten as leasing activity supports additional rental growth.
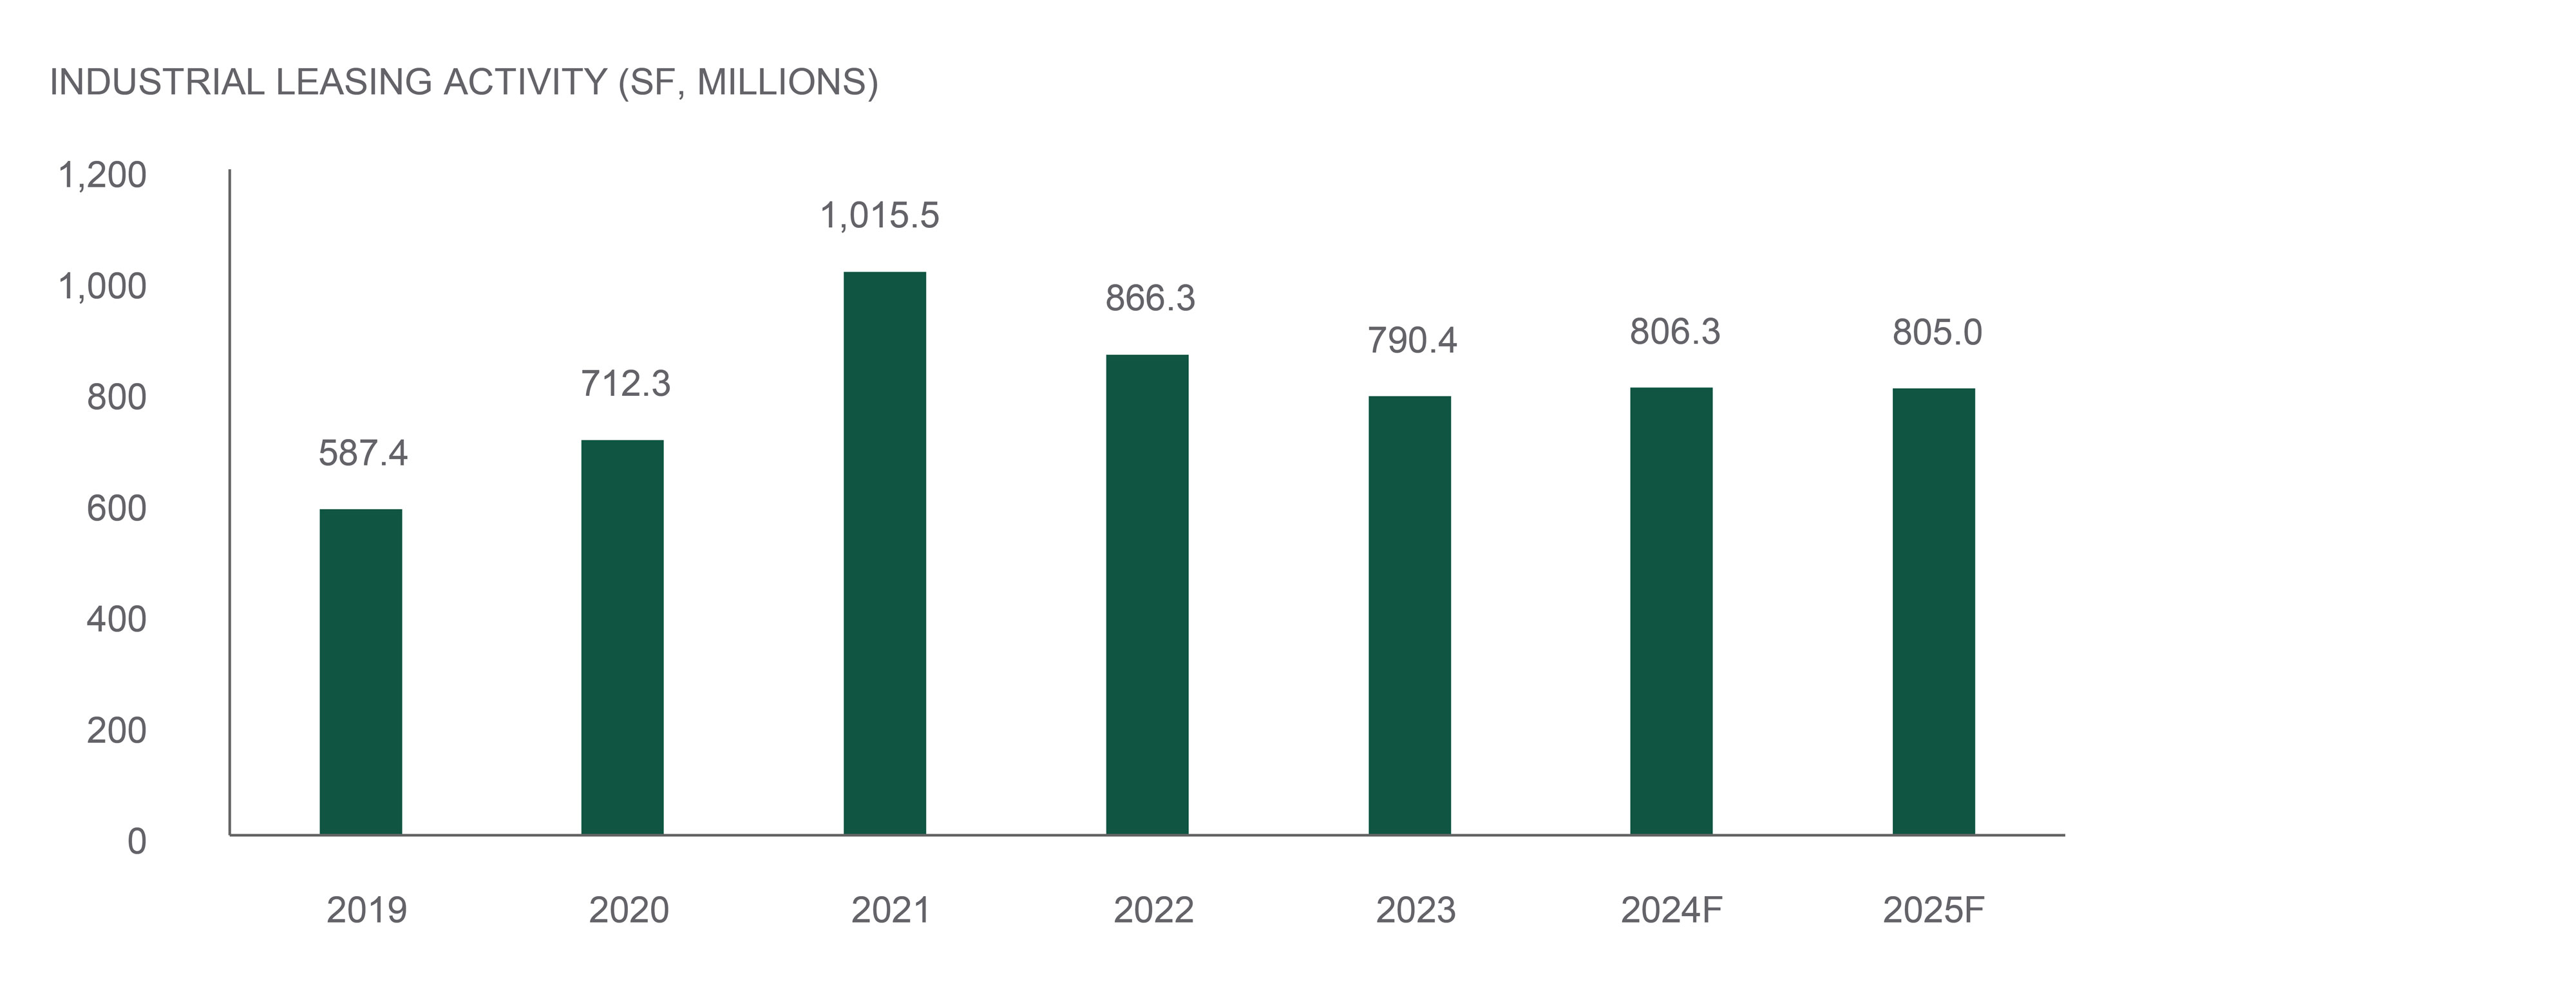
Source: Northern Trust Asset Management, CBRE Research. Data as of 10/31/2024. Includes new leases and renewals of 10,000 square feet or more. SF = square feet. Historical trends are not predictive of future results.
- U.S. economic conditions are supportive of healthy real estate markets.
- We confirm our slight overweight to real estate on stable fundamentals, discounted valuations, and private market dry powder.
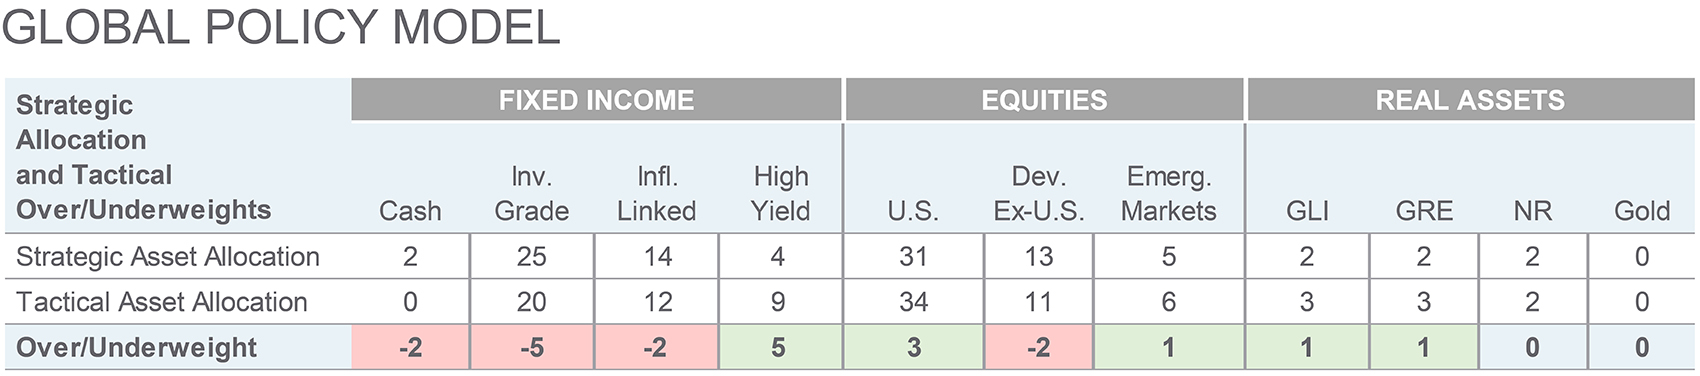
Source: Northern Trust Capital Market Assumptions Working Group, Investment Policy Committee. Strategic allocation is based on capital market return, risk and correlation assumptions developed annually; most recent model released 1/15/2025.The model cannot account for the impact that economic, market and other factors may have on the implementation and ongoing management of an actual investment strategy. Asset allocation does not guarantee a profit or protection against a loss in declining markets. GLI = Global Listed Infrastructure, GRE = Global Real Estate, NR = Natural Resources. Unless otherwise noted, the statements expressed herein are solely opinions of Northern Trust. Northern Trust does not make any representation, assurance, or other promise as to the accuracy, impact, or potential occurrence of any events or outcomes expressed in such opinions.
Unless noted otherwise, data on this page is sourced from Bloomberg as of February 2025.
IMPORTANT INFORMATION
Northern Trust Asset Management (NTAM) is composed of Northern Trust Investments, Inc., Northern Trust Global Investments Limited, Northern Trust Fund Managers (Ireland) Limited, Northern Trust Global Investments Japan, K.K., NT Global Advisors, Inc., 50 South Capital Advisors, LLC, Northern Trust Asset Management Australia Pty Ltd, and investment personnel of The Northern Trust Company of Hong Kong Limited and The Northern Trust Company.
Issued in the United Kingdom by Northern Trust Global Investments Limited, issued in the European Economic Association (“EEA”) by Northern Trust Fund Managers (Ireland) Limited, issued in Australia by Northern Trust Asset Management (Australia) Limited (ACN 648 476 019) which holds an Australian Financial Services Licence (License Number: 529895) and is regulated by the Australian Securities and Investments Commission (ASIC), and issued in Hong Kong by The Northern Trust Company of Hong Kong Limited which is regulated by the Hong Kong Securities and Futures Commission.
For Asia-Pacific (APAC) and Europe, Middle East and Africa (EMEA) markets, this information is directed to institutional, professional and wholesale clients or investors only and should not be relied upon by retail clients or investors. This information may not be edited, altered, revised, paraphrased, or otherwise modified without the prior written permission of NTAM. The information is not intended for distribution or use by any person in any jurisdiction where such distribution would be contrary to local law or regulation. NTAM may have positions in and may effect transactions in the markets, contracts and related investments different than described in this information. This information is obtained from sources believed to be reliable, its accuracy and completeness are not guaranteed, and is subject to change. Information does not constitute a recommendation of any investment strategy, is not intended as investment advice and does not take into account all the circumstances of each investor.
This report is provided for informational purposes only and is not intended to be, and should not be construed as, an offer, solicitation or recommendation with respect to any transaction and should not be treated as legal advice, investment advice or tax advice. Recipients should not rely upon this information as a substitute for obtaining specific legal or tax advice from their own professional legal or tax advisors. References to specific securities and their issuers are for illustrative purposes only and are not intended and should not be interpreted as recommendations to purchase or sell such securities. Indices and trademarks are the property of their respective owners. Information is subject to change based on market or other conditions.
All securities investing and trading activities risk the loss of capital. Each portfolio is subject to substantial risks including market risks, strategy risks, advisor risk, and risks with respect to its investment in other structures. There can be no assurance that any portfolio investment objectives will be achieved, or that any investment will achieve profits or avoid incurring substantial losses. No investment strategy or risk management technique can guarantee returns or eliminate risk in any market environment. Risk controls and models do not promise any level of performance or guarantee against loss of principal. Any discussion of risk management is intended to describe NTAM’s efforts to monitor and manage risk but does not imply low risk.
Past performance is not a guarantee of future results. Performance returns and the principal value of an investment will fluctuate. Performance returns contained herein are subject to revision by NTAM. Comparative indices shown are provided as an indication of the performance of a particular segment of the capital markets and/or alternative strategies in general. Index performance returns do not reflect any management fees, transaction costs or expenses. It is not possible to invest directly in any index. Net performance returns are reduced by investment management fees and other expenses relating to the management of the account. Gross performance returns contained herein include reinvestment of dividends and other earnings, transaction costs, and all fees and expenses other than investment management fees, unless indicated otherwise. For U.S. NTI prospects or clients, please refer to Part 2a of the Form ADV or consult an NTI representative for additional information on fees.
Hypothetical portfolio information provided does not represent results of an actual investment portfolio but reflects representative historical performance of the strategies, funds or accounts listed herein, which were selected with the benefit of hindsight. Hypothetical performance results do not reflect actual trading. No representation is being made that any portfolio will achieve a performance record similar to that shown. A hypothetical investment does not necessarily take into account the fees, risks, economic or market factors/conditions an investor might experience in actual trading. Hypothetical results may have under- or over-compensation for the impact, if any, of certain market factors such as lack of liquidity, economic or market factors/conditions. The investment returns of other clients may differ materially from the portfolio portrayed. There are numerous other factors related to the markets in general or to the implementation of any specific program that cannot be fully accounted for in the preparation of hypothetical performance results. The information is confidential and may not be duplicated in any form or disseminated without the prior consent of (NTI) or its affiliates.
Forward-looking statements and assumptions are NTAM’s current estimates or expectations of future events or future results based upon proprietary research and should not be construed as an estimate or promise of results that a portfolio may achieve. Actual results could differ materially from the results indicated by this information.
Not FDIC insured | May lose value | No bank guarantee