- Who We Serve
- What We Do
- About Us
- Insights & Research
- Who We Serve
- What We Do
- About Us
- Insights & Research
LONG-RUN RETURNS AND LONG-TERM GOAL HEDGES
Long-run market returns show stocks can underperform bonds over multi-decade holding periods. The right stock-bond mix depends on an investor’s risk aversion regardless of the length of holding period. Bond portfolios structured as a goal hedge substantially eliminate goal-funding risk over any time horizon.
The U.S. market has a long and well-documented history, serving as the original source for long-term stock and bond returns.1 That history shows that stocks have had persistently higher returns than bonds over the long run, and that equity risk (both absolute and relative to bonds) diminished with longer holding periods. One key conclusion — popularized as “stocks for the long run” — was that stock investors with sufficiently long time horizons are reliably compensated with a return premium over bonds.
However, researchers have noted several shortcomings. First, this history is too short to allow for several independent multidecade investment periods to evaluate — i.e., holding periods that would represent an investor’s actual investing lifetime. For example, there are only four independent 25-year and two independent 50-year periods within a 100-year return history. Second, the U.S. market has shown a tendency to mean revert after periods of market distress, reducing long-term risk. But efficient-markets theory (more specifically random- walk theory) suggests that mean reversion is not a reliable property of stock returns. Third, some researchers have argued that stocks should be even riskier in the long run due to the uncertainty in estimating their return and risk parameters, even after accounting for mean reversion.2 And finally, the U.S. is a single country that has experienced exceptional economic growth and market performance. Other capitalist countries had different experiences. The U.S.-only sample suffers from success bias.
The “stocks for the long run” theme was further brought into question with expanded research on historical market returns. The historical record that began as a U.S.-centric data set of 20th century returns was extended well into the 21st century (with the passage of time) and back to the 18th century. It was additionally expanded to include 125 years of market returns (since 1900) across 35 countries.3 All of these countries underperformed the U.S. stock market over the 125-year period.
Exhibit 1 displays the range of real (inflation-adjusted) returns of U.S. stocks, bonds and the stock premium (the difference between stock and bond returns) over 10-, 25- and 50-year periods between 1793 and 2024.

Extending the start date of the data to 1793 from 1926 does not change the overall “stocks for the long run” conclusion, but it does make it far less certain. Return dispersion increases with the expanded history, as minimum stock returns decrease and maximum bond returns increase. This is summarized in a reduction in the stock premium’s median and minimum returns. The right side of Exhibit 1 shows that for all holding periods the minimum return of the stock premium is now negative, and there are many 10-, 25- and 50-year outcomes with negative stock premiums. These results are further supported by the broader sample of international markets over the last 125 years. This longer, broader history of market returns tells us that there is no guarantee stocks will outperform bonds over the long run, including multidecade holding periods.
LONG-TERM GOAL HEDGES
Exhibit 1 shows that long-run bond returns are also highly uncertain. Bond risk is driven by term and default risks. Term risk is maturity or duration-related interest rate risk, while default (credit) risk is the equity-like risk prevalent in low-quality bonds.
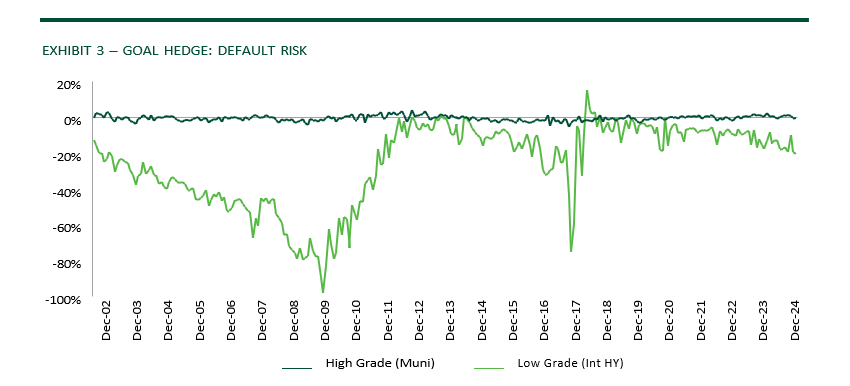
We believe assets should serve a purpose: to fund lifetime goals (e.g., lifetime consumption, gifts, etc.). When the overriding investment objective is to fund goals, investors can eliminate substantially all of the relevant investment risk of bonds over any holding period by properly constructing a goal hedge — a bond portfolio that minimizes goal-relative risk. Exhibits 2 and 3 demonstrate this principle. We fund a series of 10-year level annuities — the consumption goal — using as goal discount rates the initial yields of cash, high-yield bonds and a goal hedge composed of laddered municipal bonds.5 We then graph the dispersion (risk) in realized funding outcomes (i.e., future surplus/shortfall) based on subsequent realized returns and the timing of the 10 payouts for each annuity in the series.
Cash (Treasury bills) is commonly viewed as the safe asset due to its minimal volatility. However, its goal- relative risk is significant due to reinvestment risk. The Treasury bills that mature prior to goal funding are reinvested at new yields and the difference between those yields and the initial cash yields is what causes the significant dispersion in funding outcomes in Exhibit 2. This is fundamentally due to a mismatch in duration (term risk). On the other hand, the portfolio of high-grade, duration-aligned municipal bonds shows minimal dispersion in funding outcomes in Exhibit 2 because they mature (without defaulting) at approximately the same time as each of the 10 flows in the annuity. The use of high-grade bonds minimizes default risk while duration alignment minimizes goal-relative term risk. If an investor’s consumption goal is a different length, they would adjust the duration of the bond portfolio to match the duration of the goal.
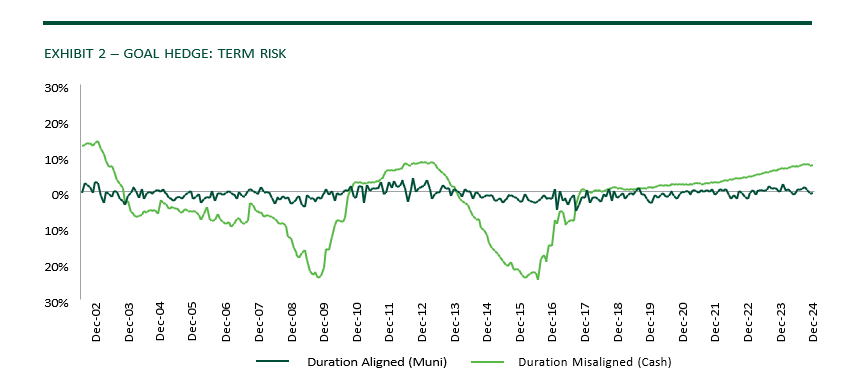
Exhibit 3 shows the risk of funding the 10-year annuity with high-yield (low-grade) bonds, which are initially duration aligned (unlike the prior cash example). High-yield bonds show significant dispersion in funding outcomes due to their substantial default risk. The initial yields of high-yield bonds are rosy estimates of their future return due to uncertain loss rates, resulting in periods when their annual cash flows are significantly less than the corresponding annuity payments. This is fundamentally due to a mismatch in quality (default risk). In contrast, the same portfolio of high-grade, duration-aligned municipal bonds shows minimal dispersion in funding outcomes in Exhibit 3.
“Stocks for the long run?” Perhaps on average, but not always. The overall historical record shows that the “expected” outcome does not always play out over the long run. There is risk, and the right stock-bond mix still depends on an investor’s overall level of risk aversion, or better yet, on their different risk/priority levels for their various goals.
While bonds have risk too, investors who engage in a goals-based investment process can use bonds to construct goal hedges that substantially eliminate goal-relative funding risk over any holding period. By employing high-grade bonds with minimal default risk and aligning their duration with goal duration, we significantly minimize the dispersion in potential future goal-funding outcomes. High-priority goals may have full goal hedges, while lower priority goals may have partial hedges (or no hedge at all if fully funded with stocks). Employing bonds as full or partial goal hedges can be prudent for investors with high-priority goals, regardless of whether those are short-term or multidecade goals. It is often said that diversification is the only free lunch in investing. For goals-based investors, goal hedging is the second free lunch.
1 See Ibbotson Stocks, Bonds, Bills and Inflation (SBBI).
2 See Pastor and Stambaugh, “Are Stocks Really Less Volatile in the Long Run?” The Journal of Finance (2012).
3 See Dimson, Marsh and Staunton, “Global Investment Returns Yearbook.”
4 Source: Bloomberg, Ibbotson Associates, CRSP and McQuarrie, “Stocks for the Long Run? Sometimes Yes, Sometimes No,” Financial Analyst Journal (2023).
5 For 254 nominal 10-year annuities, the chart shows surplus/shortfall, which is the remaining portfolio value at the end of the annuity period divided by the present value of the annuity at the beginning of the period. The dollar present value is the discounted value of the 10 annuity payments using the respective benchmark yield at the onset of the distribution period (1993 – 2024). The remaining portfolio value (2002 – 2024) is the surplus or shortfall after funding annual goals with portfolio sequentially realizing annual benchmark portfolio returns for each of the 10 years in the planning period. The index of high- grade and average duration aligned bonds is a Muni 1–10-year (Duration Matched) portfolio that is a time varying blend of Bloomberg Municipal Indices (1–2 year, 2–4 year, 4–6 year, 6–8 year and 8–12 year). Cash is the Bloomberg 1-3 Month Short Treasury Index. Int HY is the Bloomberg US Corporate High Yield Intermediate Index. Data are monthly values since earliest common index inception of July 1993 and through December 2024

© 2025 Northern Trust Corporation. Head Office: 50 South La Salle Street, Chicago, Illinois 60603 U.S.A. Incorporated with limited liability in the U.S.
This document is a general communication being provided for informational and educational purposes only. The opinions and conclusions expressed herein are those of the authors and are not meant to be taken as investment advice or a recommendation for any specific investment product or strategy and does not take your financial situation, investment objective or risk tolerance into consideration. Performance examples are hypothetical and for illustration purposes only and actual results may be lower or higher than a portfolio that may be more or less diversified and/or managed in a different manner. In performing its services, Northern Trust will take into account other relevant facts and circumstances such that positions and transactions for any particular client account may differ with the investments described herein. Northern Trust provides fiduciary and investment management services to various types of accounts, including but not limited to, separately managed accounts, registered and unregistered funds. The investment advice given to one client account may differ from the investment advice given to another client account. Northern Trust and its affiliates may have positions in, and may effect transactions in, the markets, contracts and related investments described herein, which positions and transactions may be in addition to, or different from, those taken in connection with the investments described herein. All information discussed herein is current only as of the date of publication and is subject to change at any time without notice. This material has been obtained from sources believed to be reliable, but its accuracy, completeness and interpretation cannot be guaranteed. Readers, including professionals, should under no circumstances rely upon this information as a substitute for their own research or for obtaining specific legal, accounting or tax advice from their own counsel.
All investments involve risk and can lose value. The market value and income from investments may fluctuate in amounts greater than the market. Forecasts may not be realized due to a multitude of factors, including but not limited to, changes in economic conditions, corporate profitability, geopolitical conditions or inflation.
LEGAL, INVESTMENT AND TAX NOTICE. This information is not intended to be and should not be treated as legal, investment, accounting or tax advice.
PAST PERFORMANCE IS NO GUARANTEE OF FUTURE RESULTS. Periods greater than one year are annualized except where indicated. Returns of the indexes also do not typically reflect the deduction of investment management fees, trading costs or other expenses. It is not possible to invest directly in an index. Indexes are the property of their respective owners, all rights reserved.