We field a lot of questions about recession these days: is one is imminent, or already underway? A reliable leading indicator of recession has added to the urgency of these inquiries. Every day since November 8, 2022, the nominal yield of the 3-month U.S. Treasury bill has closed higher than that of the 10-year note. The difference now exceeds a full percentage point.
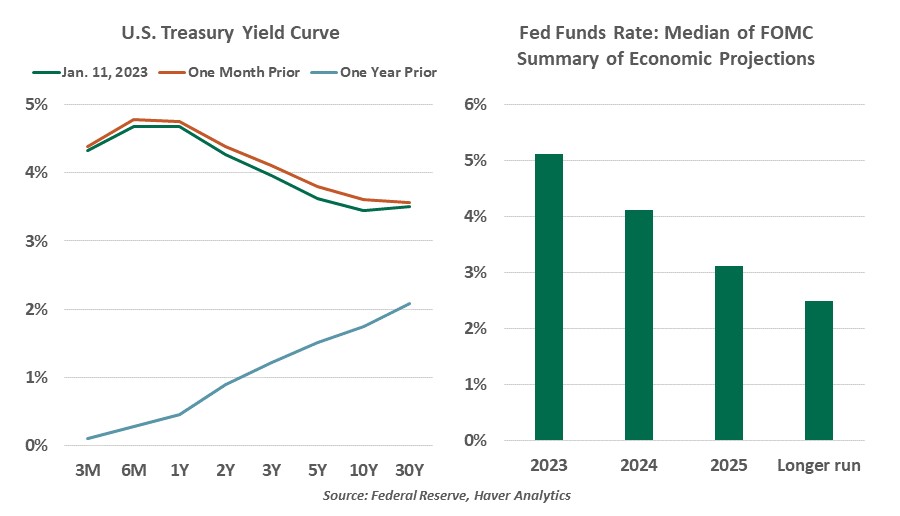
Longer-term bond yields reflect the sum of the expected interest rates that would be earned by rolling short-term debt over extended periods, plus a term premium to compensate for locking up capital. In a steady market, bonds should have higher yields for longer terms. Today’s inversion is due to the market’s implicit forecast that short-term yields will fall in the coming years. By the Federal Reserve’s own estimates, today’s rates are in restrictive territory and are likely to be cut to a neutral level as we move through time.
Pricing in lower expected yields in the future pushes down the yield of longer-dated debt. The current yield curve tells this story: rates are forecast to stay high for about a year before cuts commence, thus causing an inflection and downward slope after the one-year term point.
But this explanation is cold comfort in the face of the curve’s record of indicating recessions. An inversion has preceded every economic contraction since 1970. We ignore it at our peril, but we are also frustrated by its ambiguity. As a forward-looking indicator, it is as informative as a “check engine” light on a vehicle’s dashboard. Something is amiss, but the driver often cannot tell what the problem may be.
Famous last words: “It’s different this time.”
The downward-sloping curve offers no further information about the future contraction. Past inversions did not signal an immediate recession; gaps between inversions and recessions measure in the months or even years. The sustained inversion beginning in July 2006 turned positive after a year, and the Global Financial Crisis did not take hold until 2008.
There is no mathematical link between sovereign bond yields, real economic activity and recessions. Some of the past correlations were spurious. An inversion from May to October 2019 fueled recession conjecture. At the time, we rebutted conventional wisdom that the economy was somehow due for a recession. A severe contraction did indeed follow nine months after the inversion, but it does not stand to reason that fixed income markets priced in a pandemic.
Even if the signal were empirically firm, the inversion tells us nothing about the length or severity the looming recession. We should not assume that every recession will bring the shock of COVID or the lasting damage of the financial crisis. And investors looking for a timing signal will be disappointed: returns during inversions are often positive, and bear markets have happened with the yield curve sloping in any direction.
Even the author of the first published research into the yield curve is questioning its value in this cycle. Professor Campbell Harvey said today’s inversion may be a false signal. High labor demand, strong balance sheets and a flat inflation-adjusted curve suggest that the old logic may not hold. This time, the inversion may simply reflect a slowing economy.
We acknowledge the danger of suggesting that this time is different. The economy is in a delicate phase, and recession risk is elevated. The implicit logic of the yield curve as a signal is that short-term rates are cut only in the event of a crisis, but we do not believe a recession is inevitable.
So much about the current pandemic-driven cycle of decline and recovery has been beyond precedent. The restrictions and reopening of activity, the loss and recovery in employment, the generosity and contraction of stimulus, and the accommodation and tightening of monetary policy have all breached the bounds of historical experience. Optimistically, the downward-sloping curve is pointing the path toward a soft landing, but we will stay braced for a harder one.